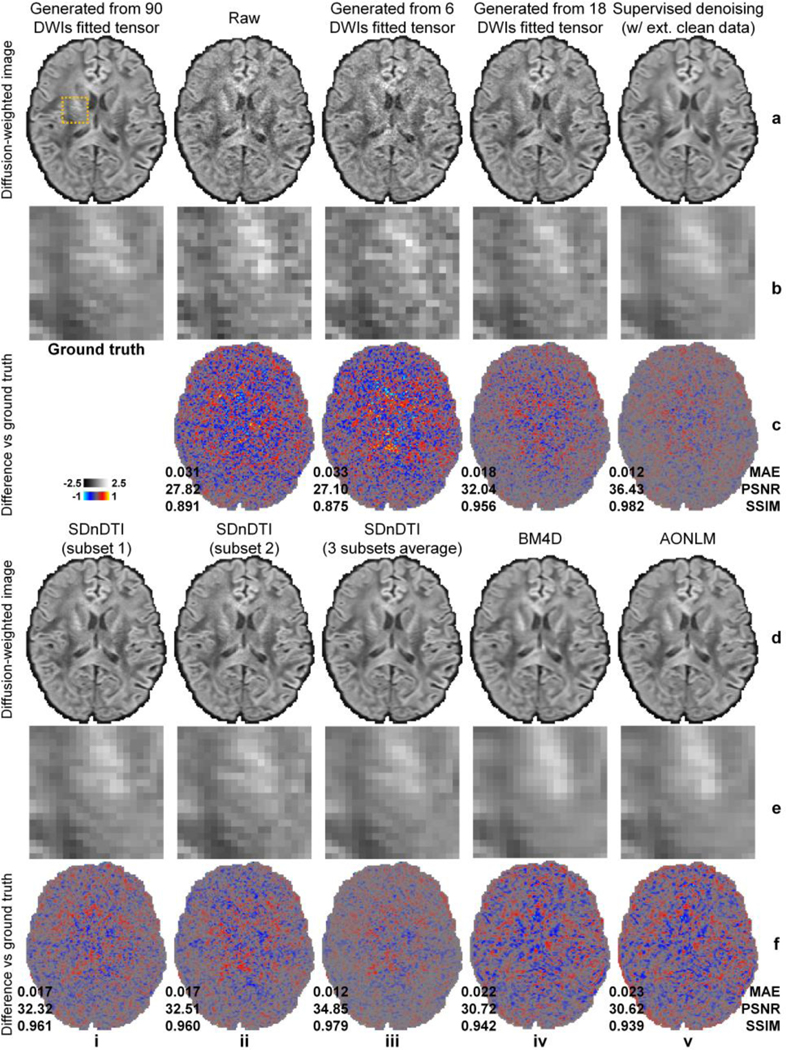
Figure 3. Denoised images.

Diffusion-weighted images (DWIs) sampled approximately along the superior-inferior direction (i.e., [−0.18, 0.26, −0.95]) of a representative HCP subject from the ground-truth data (i.e., synthesized from the diffusion tensor fitted using all 18 b = 0 images and 90 DWIs) (a, i), subset 1 of SDnDTI input data (i.e., raw acquired image) (a, ii), subset 2 of SDnDTI input data (i.e., synthesized image using the diffusion tensor fitted using three b = 0 images and six DWIs) (a, iii), synthesized data from the diffusion tensor fitted using three b = 0 images and 18 DWIs (a, iv), supervised learning denoised data using MU-Net with the ground-truth data as the training target (a, v), subset 1 of SDnDTI-denoised data (d, i) (i.e., the raw DWI (a, ii) denoised by SDnDTI), subset 2 of SDnDTI-denoised data (d, ii) (i.e., the synthesized DWI (a, iii) denoised by SDnDTI), the average of all three subsets of SDnDTI-denoised data (d, iii), BM4D-denoised data (d, iv), and AONLM-denoised data (d, v), along with a region of interest in the deep white matter with fine textures (yellow box in a, i) displayed in enlarged views (rows b, e) and residual images compared to the ground-truth DWI (rows c, f). The mean absolute error (MAE), peak signal-to-noise ratio (PSNR) and the structural similarity index (SSIM) of different images compared to the ground-truth DWI are used to quantify image similarity compared to the ground truth.
