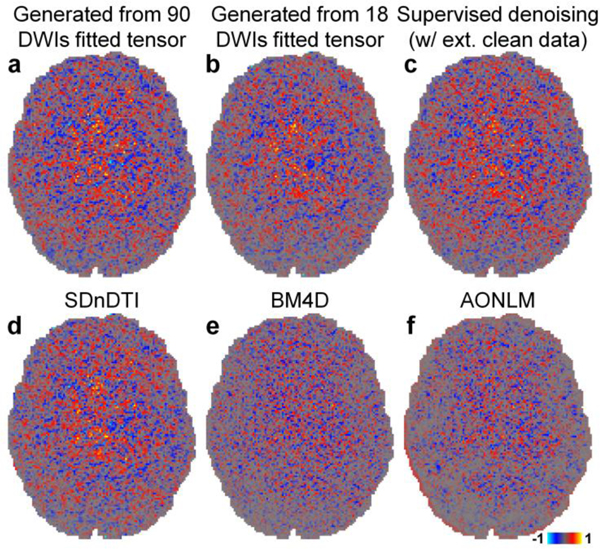
Figure 4. Noise map.
Maps of the difference between the raw acquired diffusion-weighted image (DWI) sampled approximately along the superior-inferior direction (i.e., [−0.18, 0.26, −0.95]) shown in Figure 3 and the denoised DWIs from different methods (i.e., the estimated noise maps) of a representative HCP subject.

