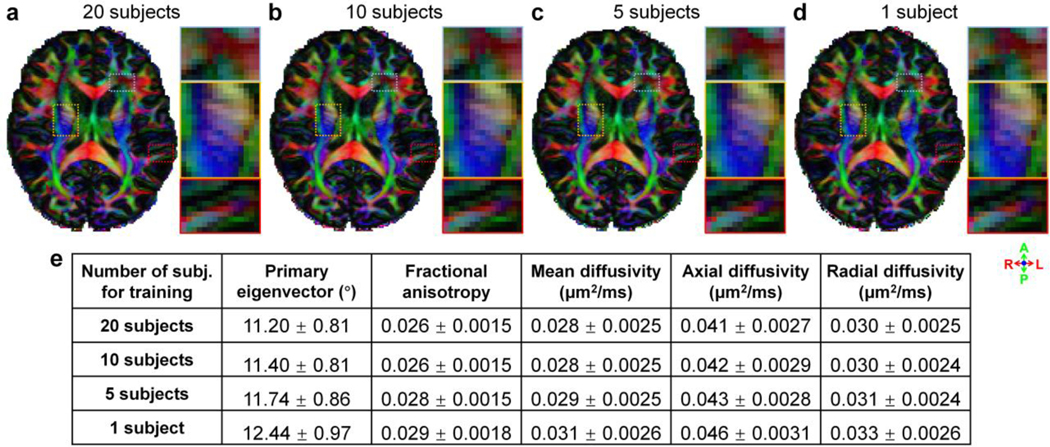
Figure 7. Effects of training data.
Fractional anisotropy maps color encoded by the primary eigenvector (red: left–right; green: anterior–posterior; blue: superior–inferior) derived from the raw data consisting of 3 b = 0 and 18 DWIs denoised by SDnDTI trained using data of 20 subjects (a), 10 subjects (b), 5 subjects (c) and 1 subject (d) from the HCP. Three regions of interest in the deep white matter (yellow boxes) and sub-cortical white matter surrounded by gray matter (red boxes) or with intersecting fiber tracts (blue boxes) are displayed in enlarged views. The table lists the group mean (± group standard deviation) across the 20 HCP subjects of the mean absolute error (MAE) of different DTI metrics compared to the ground-truth DTI metrics derived from 18 b = 0 and 90 DWIs.

