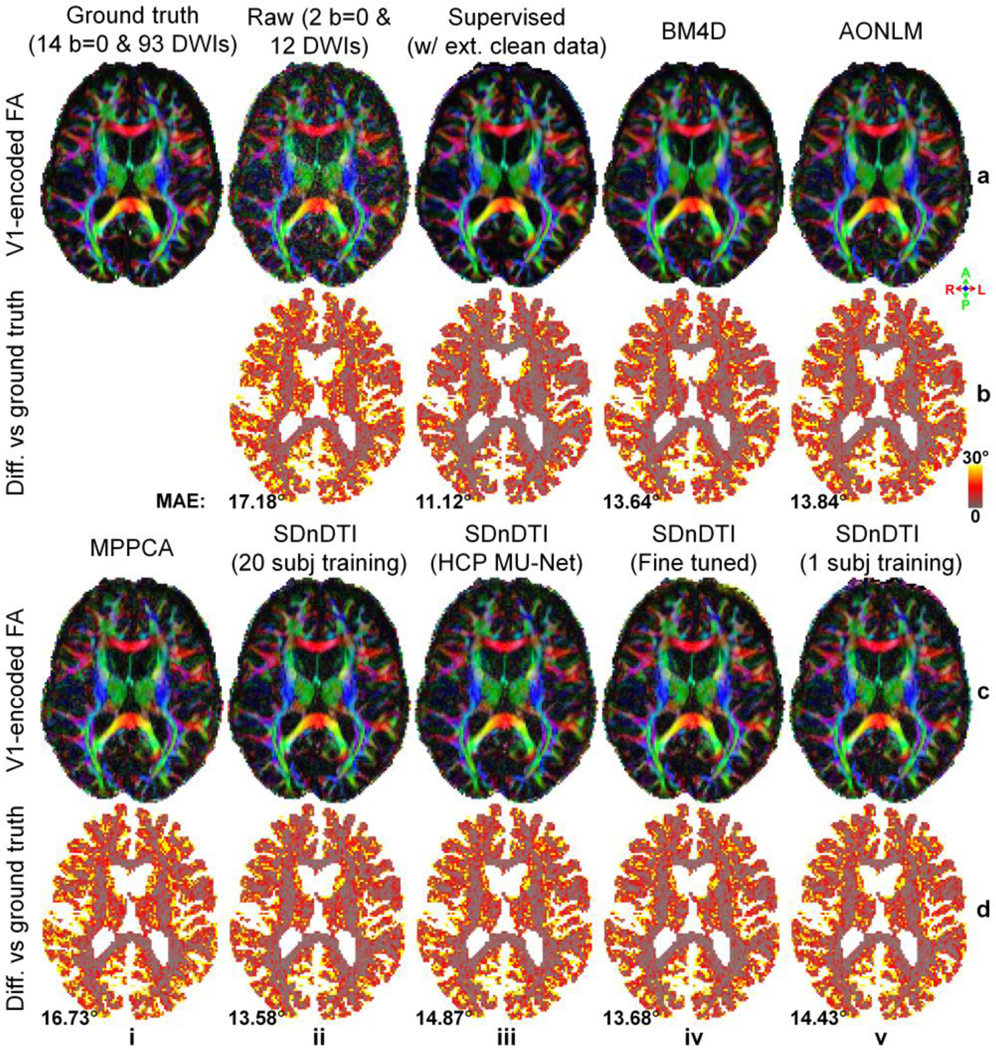
Figure 8. Primary eigenvector.

Maps of color-encoded primary eigenvector (red: left–right; green: anterior–posterior; blue: superior–inferior) modulated by the fractional anisotropy (row a, c) derived from the diffusion tensors fitted using all 14 b = 0 and 93 diffusion-weighted images (DWIs) (ground truth, a, i), raw data consisting of two b = 0 and 12 DWIs (a, ii), the raw data denoised by supervised learning with the ground-truth DWIs as the training target (i.e., supervised denoising) (a, iii), BM4D (a, iv), AONLM (a, v) and MPPCA (c, i), and SDnDTI (c, ii–v), and their residual maps (rows b, d) compared to the ground-truth map from a representative HCP-A subject. SDnDTI results were generated by an MU-Net trained on the data from 20 HCP-A subjects (c, ii), an MU-Net trained on the data from 20 HCP subjects (c, iii), an MU-Net with parameters from the MU-Net trained on the data from 20 HCP subjects as initialization and further fine-tuned using the data of each HCP-A subject (c, iv), and an MU-Net trained on the data from the data of each HCP-A subject (c, v). The mean absolute error (MAE) of each map compared to the ground truth within the brain (excluding the cerebrospinal fluid) is displayed at the bottom of the residual map.
