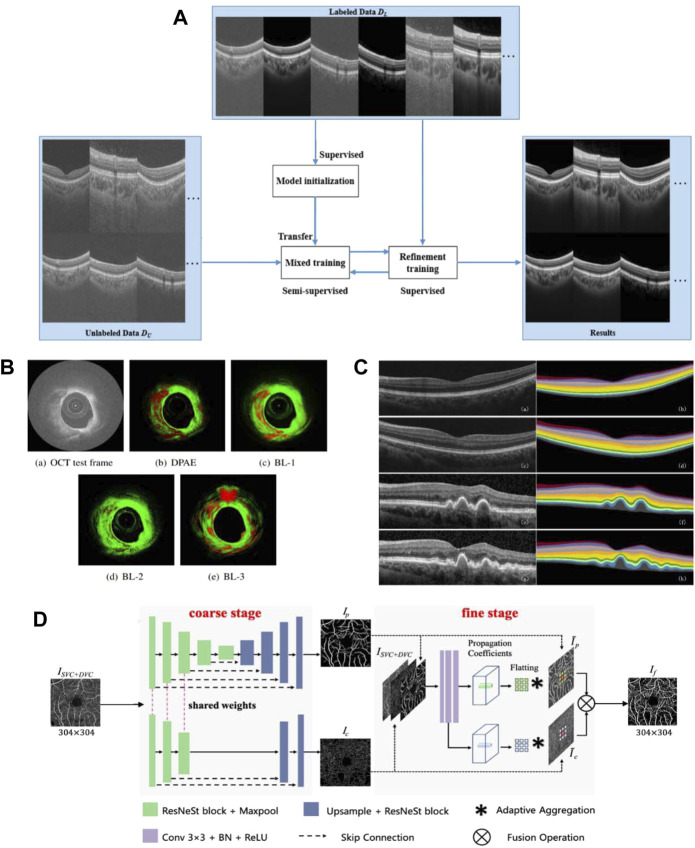
FIGURE 10.
Related achievements of AI processing OCT images. (A) structure of the proposed semi-supervised system (adapted and modified from Wang et al., 2021). (B) The result of plaque detection, the red area represents the detected plaque, and the green area represents the normal tissue (adapted and modified from Roy et al., 2016). (C) Retinal 10-layer segmentation prediction results, The left is the original image, the right is the segmentation result (adapted and modified from Li et al., 2019). (D) Architecture of the proposed OCTA-Net network (adapted and modified from Ma et al., 2021).

