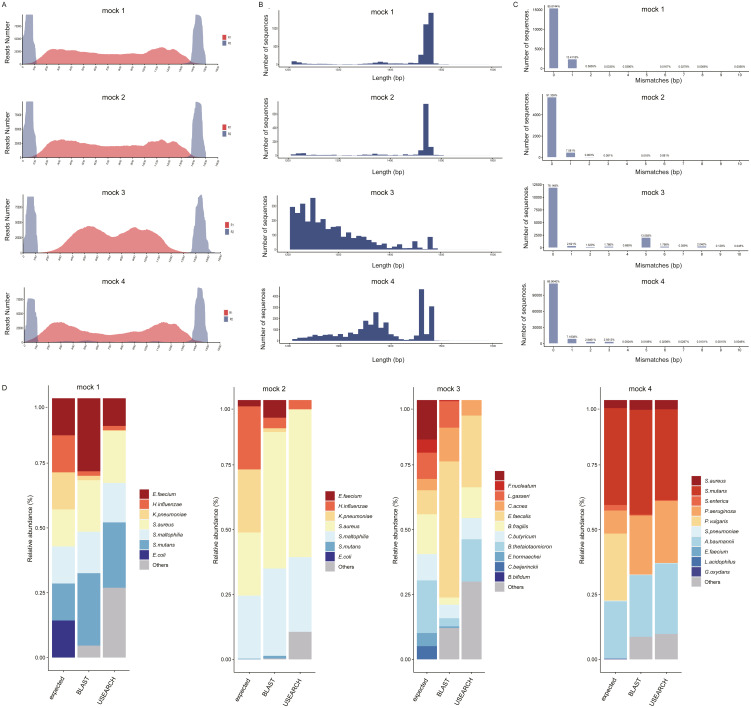
Figure 2. Analysis results of 16S-FASAS on mock samples.
(A) Sequencing coverage of mock samples. The X-axis represents the variant region of the 16S rRNA gene. The y-axis represents the number of read 1 (red) and read 2 (blue). (B) The length distribution of mock samples’ contigs. (C) Mismatch distribution from the mock communities. The numbers indicate the percent of all assembled contigs. (D) Comparison of the influence of the classification methods on taxonomic assignment in mock communities. The bar chart represents the relative abundance of species in percentages.

