Figure 7.
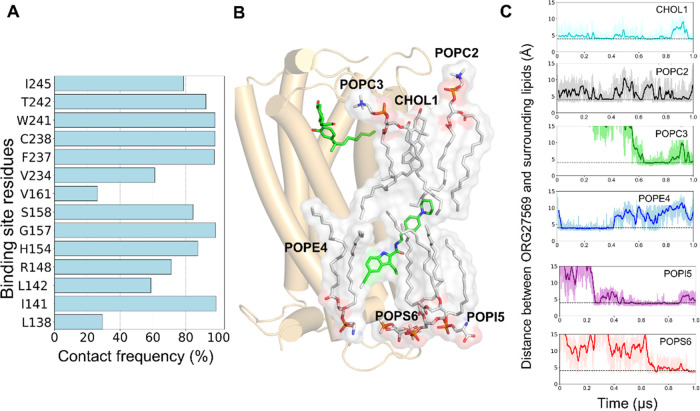
Contribution of the binding site residues and lipids to the overall binding of ORG27569 to CB1R (PDB ID 6KQI). (A) Contact frequency (%) of ORG27569 accounts for the extent of molecular interactions with the binding site residues. The contact frequency represents the fraction of the total simulation time during which a given residue is within 4 Å of the ligand. For example, the binding site residues, C2384.47, W2414.50, and F2374.46, are in close contact with ORG27569 for >95% of the simulation time. (B) Several membrane lipids such as cholesterol, POPC, POPE, POPI, and POPS are directly in contact with ORG27569 likely stabilizing the ligand within the binding site, as observed during the 1 μs long unbiased all-atom MD simulation. (C) Distances between ORG27569 and several lipids were monitored during the entire simulation. The dotted lines represent an arbitrary 4 Å distance in the graphs. The distances are shown for cholesterol (CHOL1, deep sky blue), phosphatidylcholine (POPC2, black), phosphatidylethanolamine (POPE4, blue), phosphatidylinositol (POPI5, purple), and phosphatidylserine (POPS6, red).

