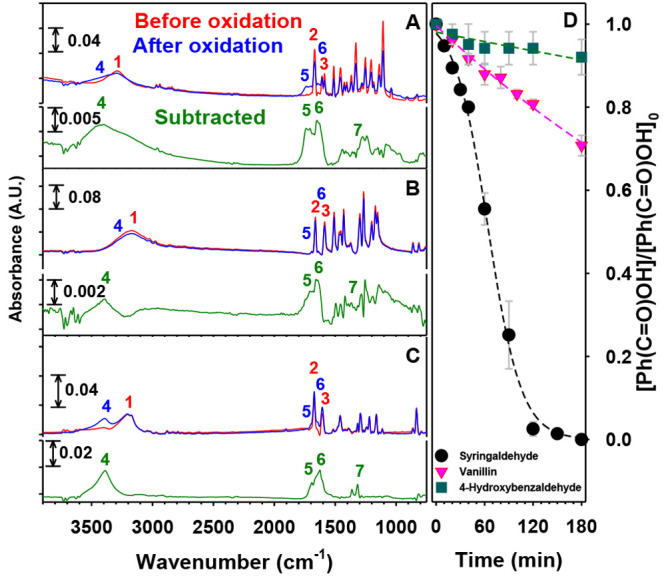
Figure 2.

FTIR spectra of thin films of (A) syringaldehyde, (B) vanillin, and (C) 4-hydroxynenzaldehyde (red) before and (blue) after 1 h of oxidation by 207 ppmv O3(g) at 74% RH. The green traces show the subtracted spectra for the three compounds after the remaining precursor was factored out. (D) Decays of phenolic aldehydes relative to their initial concentrations ([Ph(C=O)OH]/[Ph(C=O)OH]0) vs time for 3 h experiments under the conditions for (A–C). Key: black circles, syringaldehyde; pink triangles, vanillin; teal squares, 4-hydroxybenzaldehyde. Dashed lines are provided as guides to the eye only.
