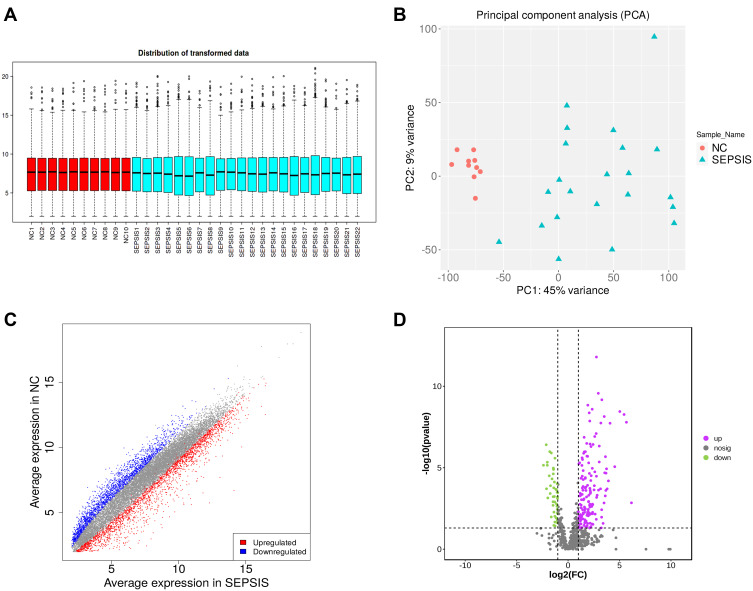
Figure 2.
Data quality control and differential screening. (A) the y-axis of box plot represents logarithmicized FPKM (Fragments Per Kilobase of exon model per Million mapped fragments), also known as log10 (FPKM), and showing that the data of each sample are homogenized and distributed at the same level and are comparable; (B) PCA showing that the two groups are clearly distinguishable and there were no outliers; (C) volcano plot showing up-regulated (red) and down-regulated (blue) genes screened by differential analysis, the horizontal coordinate is the gene expression in the sepsis group and the vertical coordinate is the gene expression in the normal group; (D) volcano plot showing up-regulated (purple) and down-regulated (green) proteins screened by differential analysis, with the logarithm of the difference multiplicity (log2) as the horizontal coordinate and the negative logarithm of the p-value (log10) as the vertical coordinate.

