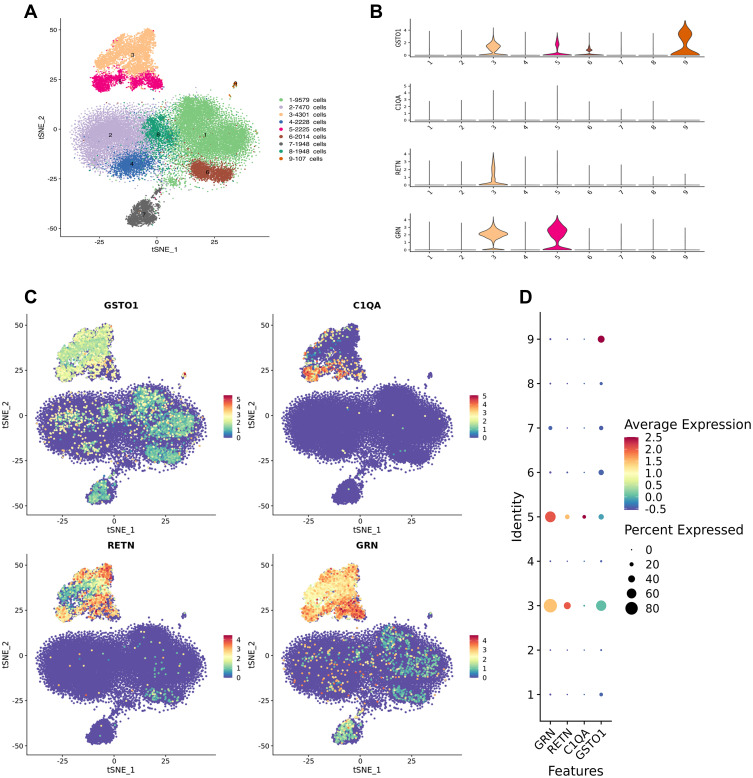
Figure 6.
Single-cell RNA sequencing. (A) General map of sequencing of mixed samples. Cell populations 1,2,6 and 8 are T cells, 3 and 5 are macrophages, 4 is NK cells, 7 is B cells, and 9 is platelets. (B–D) suggest that core genes GSTO1, C1QA, RETN, and GRN are mainly localized in 3 and 5 cell populations, that is, macrophage lines.

