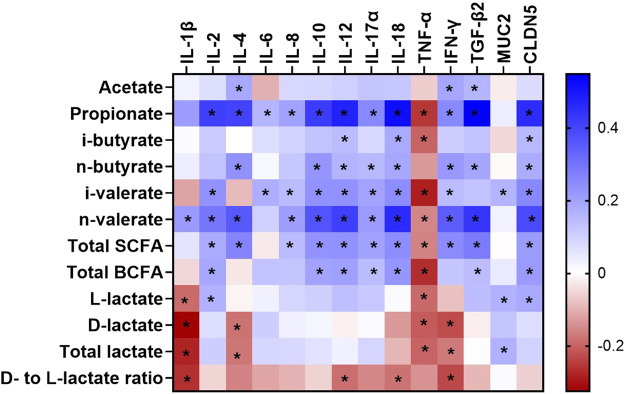
FIGURE 1.
A heatmap showing the Spearman’s correlation coefficient between metabolites and mRNA abundance in the caecum of broilers between day 7 and 35 of age. The colors represent the correlation, with blue being more positive and red being more negative. Significance is given as * (p < 0.05). SCFA, short chain fatty acid; BCFA, branched chain fatty acid; IL, interleukin; TNF-α, tumor necrosis factor alpha; IFN-γ, interferon gamma; TGF-β2, transforming growth factor beta 2; CLDN5, Claudin 5; MUC2, Mucin 2.

