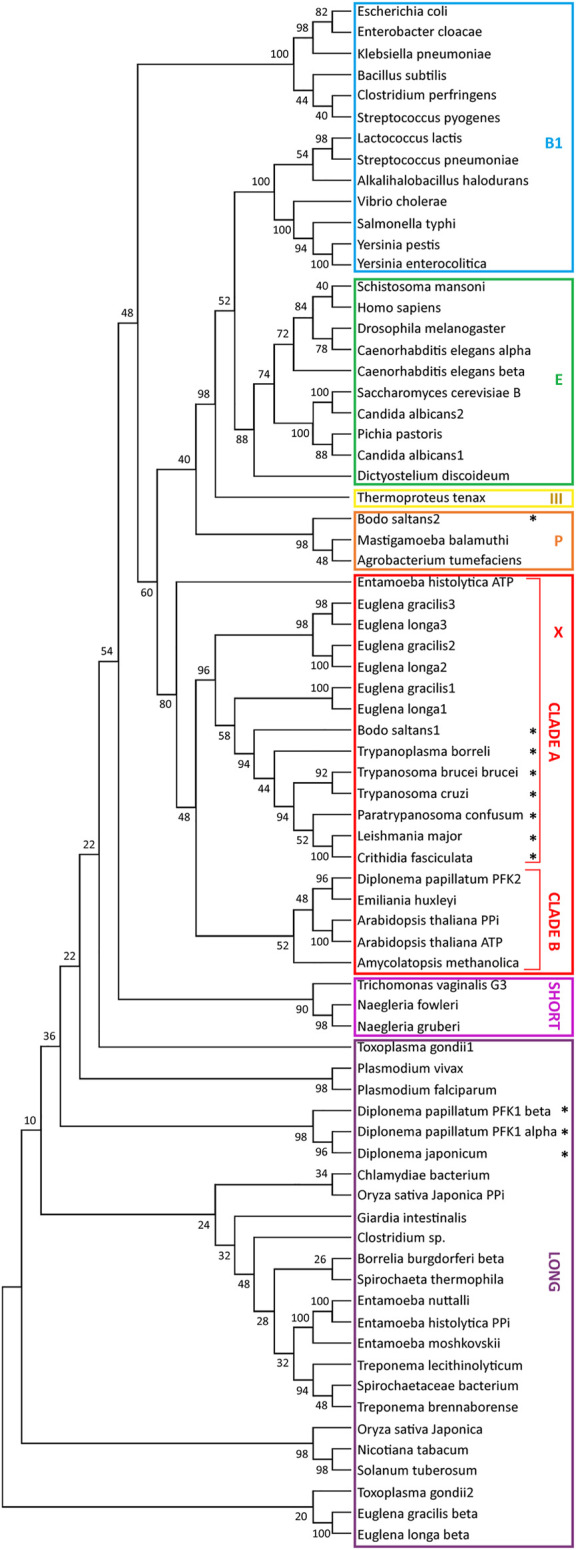
FIGURE 3.

Relationships between phosphofructokinase (PFK) sequences. The evolutionary history of PFK sequences was inferred by from their amino-acid sequences by using the Maximum Likelihood method and JTT matrix-based model (Jones et al., 1992). For each enzyme analysed, a bootstrap consensus tree inferred from 500 replicates (Felsenstein, 1985) was taken to represent the evolutionary history (Felsenstein, 1985). Branches corresponding to partitions reproduced in less than 50% bootstrap replicates were collapsed. The percentage of replicate trees in which the associated taxa clustered together in the bootstrap test (50 replicates) are shown next to the branches of the trees (Felsenstein, 1985). Initial tree(s) for the heuristic search were obtained automatically by applying the Maximum Parsimony method. All positions with less than 95% site coverage were eliminated, i.e., fewer than 5% alignment gaps, missing data, and ambiguous bases were allowed at any position (partial deletion option). Evolutionary analyses were conducted in MEGA X (Kumar et al., 2018). The analysis involved 75 amino-acid sequences, with a total of 242 positions in the final dataset. The stars indicate sequences with a PTS1. Sequences used for the construction of the tree were retrieved from the following databases: NCBI, TriTrypDB and AmoebaDB and uploaded in FASTA format. The sequences were aligned with Clustal and the alignment was manually refined with the program MEGA X. The nomenclature of the clades was taken from Bapteste et al., 2003.
