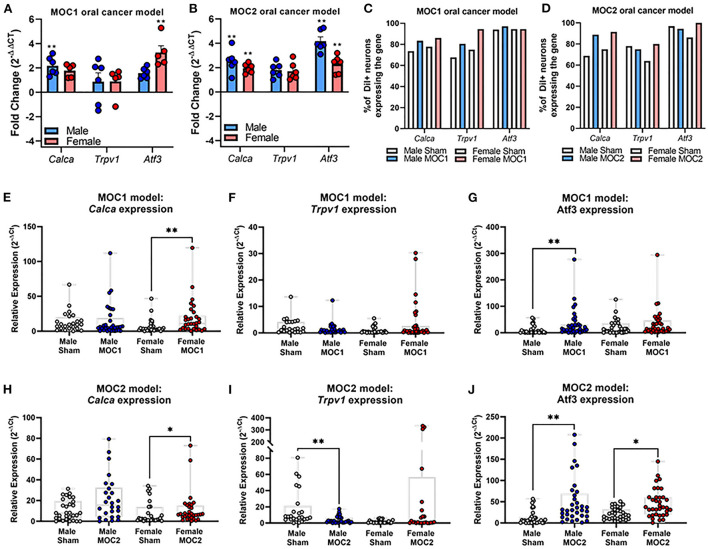
Figure 3.
Oral cancer-induced changes in pain-related gene expression. Quantitative PCR was performed to assess changes in Trpv1, Calca, and Atf3 in whole ganglia from (A) sham and MOC1 tumor-bearing mice at PID40 as well as (B) sham and MOC2 tumor-bearing mice at PID14. Gapdh was used as an internal control. Significance was determined by comparing delta CT values between treatment groups within sexes (n = 5–6/sex/group, Independent t-test, **p < 0.01). To assess changes in target genes at the single cell level, retrogradely labeled tongue-innervating TG neurons were manually picked to perform single-cell PCR (n = 36 neurons from 3 mice/sex/treatment). Gene expression was calculated for relative mRNA expression in each cell for each gene. GusB was used as an internal control. The percentage of neurons expressing the target genes was calculated for (C) sham and MOC1 tumor-bearing mice at PID40 as well as (D) sham and MOC2 tumor-bearing mice at PID14. (E–J) Relative mRNA expression values from single-cell PCR for each gene are presented as max to min with all points shown. Expression intensities for each gene between groups was compared using non-parametric Kruskal-Wallis with Bonferroni post hoc test. *p < 0.05, **p < 0.01.

