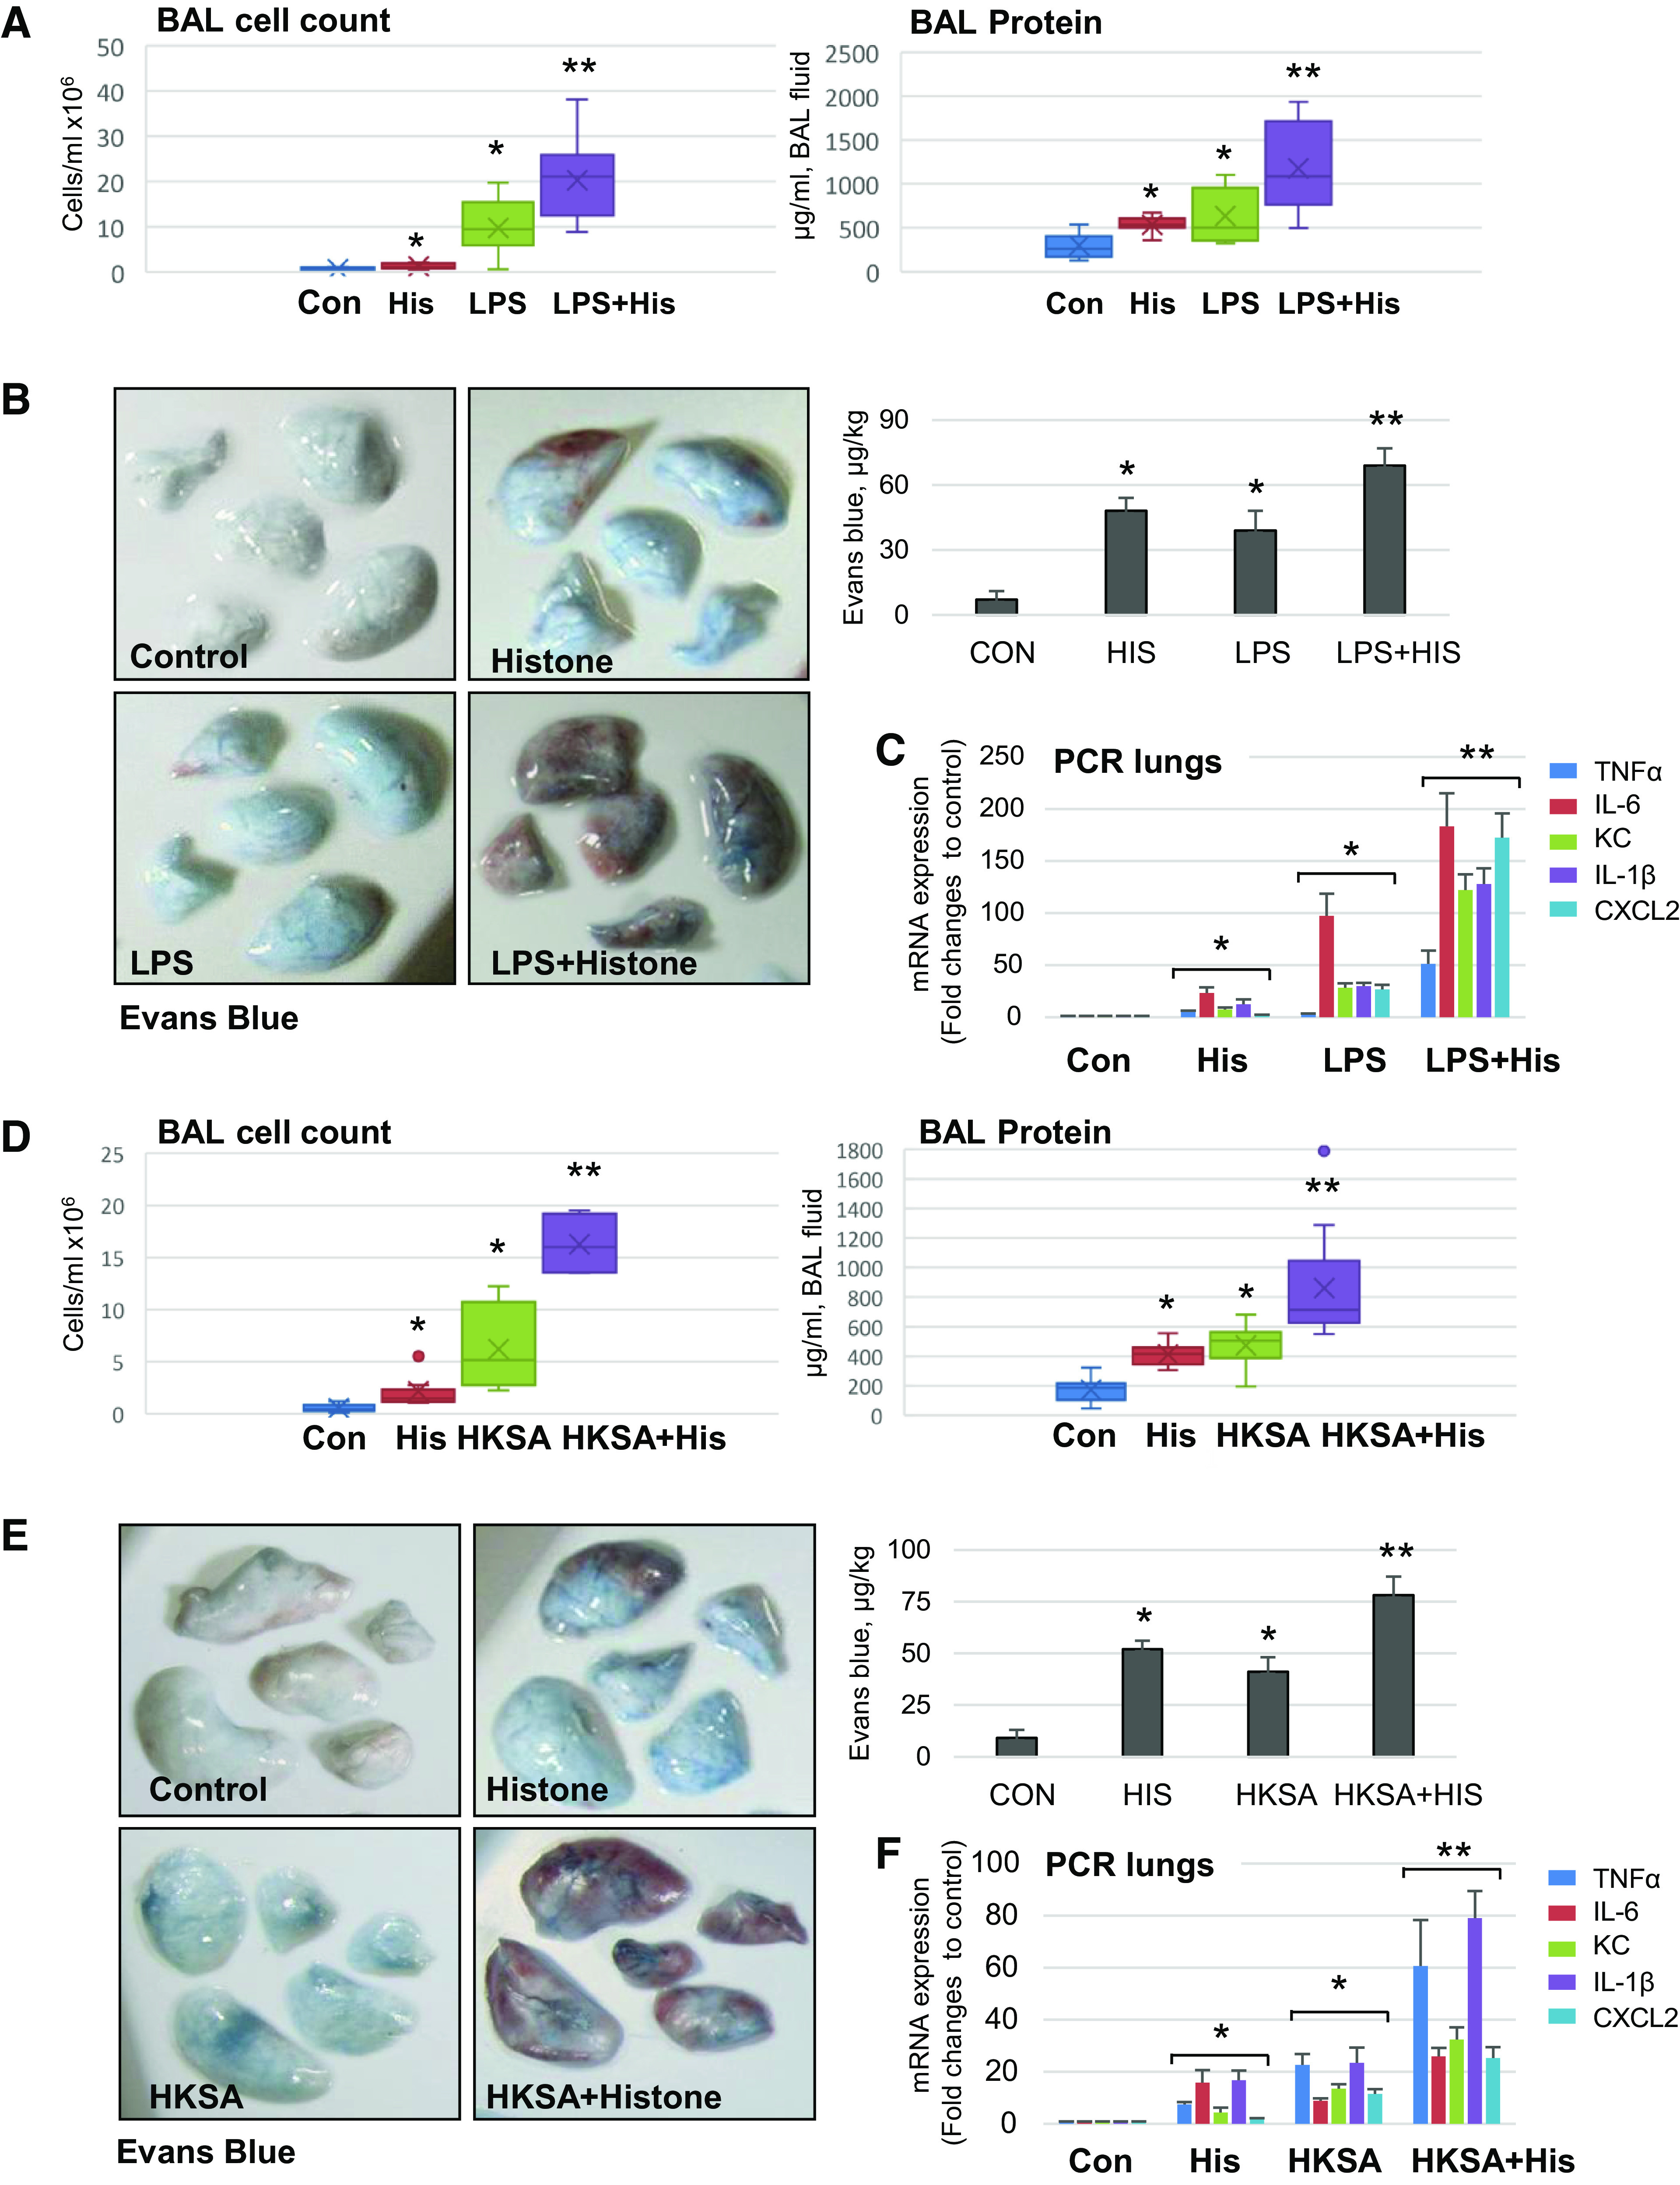
Figure 8.

Circulating histone exacerbates LPS- and HKSA-induced ALI in mice. C57BL/6 mice were treated with calf thymus histone (25 mg/kg iv), LPS (0.75 mg/kg it), or HKSA (2 × 10⁸ particles/mouse, in) alone, or with combination of histone with LPS (A–C) or HKSA (D–F) for 18 h. Lung injury was evaluated by analysis of BAL samples for total cell count and protein content (A and D). Shown data are means ± SD, n = 8–12, *P < 0.05 vs. control; **P < 0.05 vs. histone or agonist alone by ANOVA. B and E: images of Evans blue incorporation in the lungs. Bar graphs depict quantitative analysis of Evans blue-labeled albumin extravasation performed by spectrophotometric analysis of Evans blue extracted from the lung tissue samples; *P < 0.05 vs. control; **P < 0.05 vs. H3, LPS, or HKSA alone, n = 4. C and F: real-time PCR was performed from mice lung samples to determine mRNA transcript levels of indicated proinflammatory cytokines and chemokines. Shown data are means ± SD, n = 6, *P < 0.05 vs. control; **P < 0.05 vs. histone or agonist alone. HKSA, heat-killed S. aureus; LPS, lipopolysaccharide.
