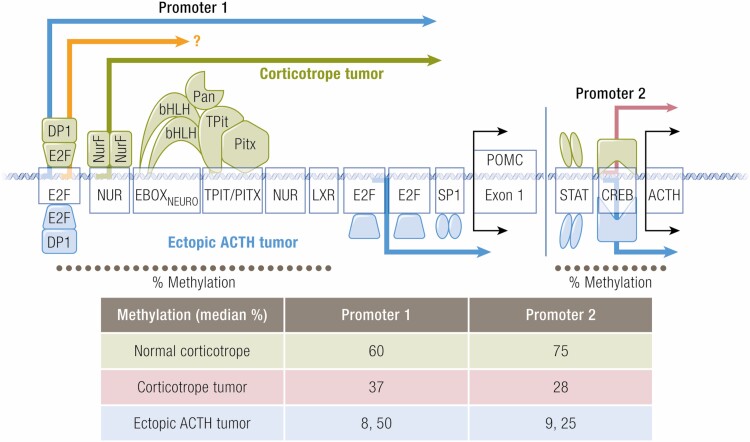
Figure 2.
Representational schema promoter regions 1 and 2 of the human proopiomenocortin gene. Shown are the response elements, (the DNA binding regions) that are important for transcription, and some of the co-factors for each, many of which recruit additional factors to the response element complex. The symbols and arrows denote transcription as follows: green, normal corticotopes and corticotrope tumors 2) pink, corticotrope tumor (not normal cells), 3) orange, unknown whether used by normal or tumoral corticotropes 4) blue, ectopic ACTH-secreting tumors. The estimated median percentage of methylation for the two promoter regions for corticotrope and ectopic ACTH-secreting tumors, and normal tissue is shown in the table below, for the DNA regions denoted by the dotted line (estimated from reference 58). Note that individual estimates for two patients with ectopic ACTH secretion are shown.

