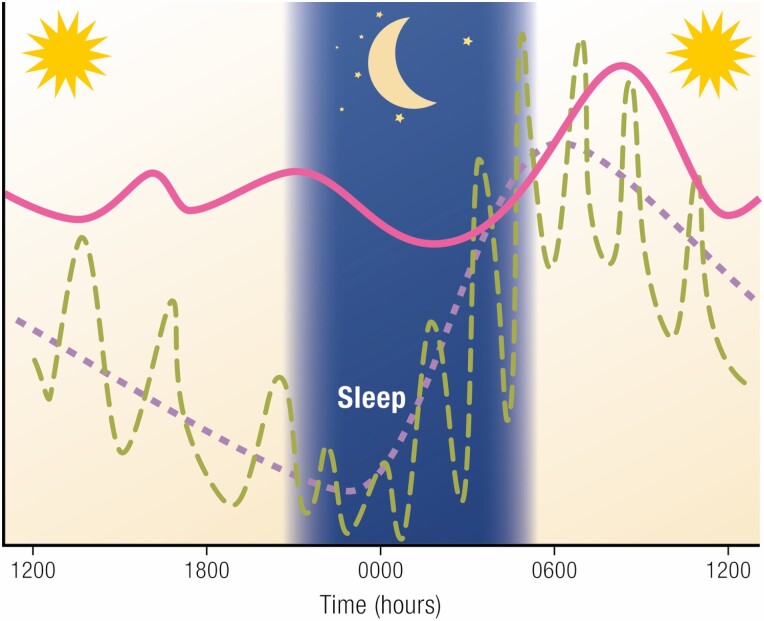
Figure 3.
Schematic representation of cortisol patterns over 24 h, showing ultradian pulses (green dashed line) and mean values (purple dashed line) in healthy individuals. The normal nadir is tightly entrained to the onset of sleep. The pink line represents the relatively invariant levels seen in Cushing’s syndrome, in which the bedtime nadir is lost.

