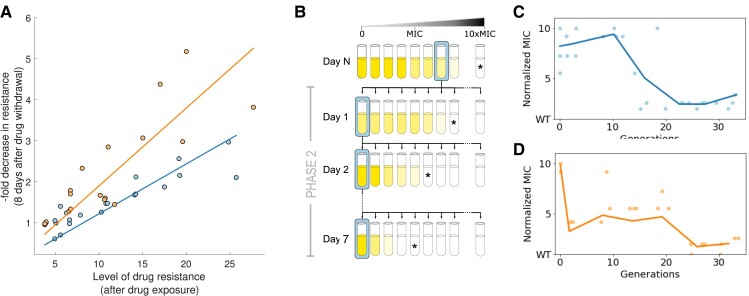
Fig. 2.
Evaluating the stability of resistance of populations evolved under different selection regimes. (A) Reduction in resistance after a period of relaxed selection (Phase 2) appears to be negatively correlated with the level of resistance achieved after the adaptive ramp (Phase 1). Each point corresponds to a population sampled at different time-points of Phase 1 (every time there was a measurable increase in MIC of the population). Lines denote best-fit linear regression for data obtained for each regime ( and for MS and SS, respectively). Note how populations that evolved under SS appear to be more unstable than mutations emerging under mild selection, independently of the degree of resistance. (B) Schematic representation of Phase 2 of the evolutionary experiment consisting of transferring the evolved populations obtained at the end of Phase 1 into a drug-free environment, and performing a 7-day serial dilution protocol in the absence of selection for resistance. (C) Reduction in resistance measured daily during Phase 2. Dots represent a dose–response experiment for different replicate populations, and blue solid line is the mean over all replicates (). (D) Populations evolved under SS present a rapid reduction in resistance after growing in a drug-free environment for eight serial dilutions (30 generations).

