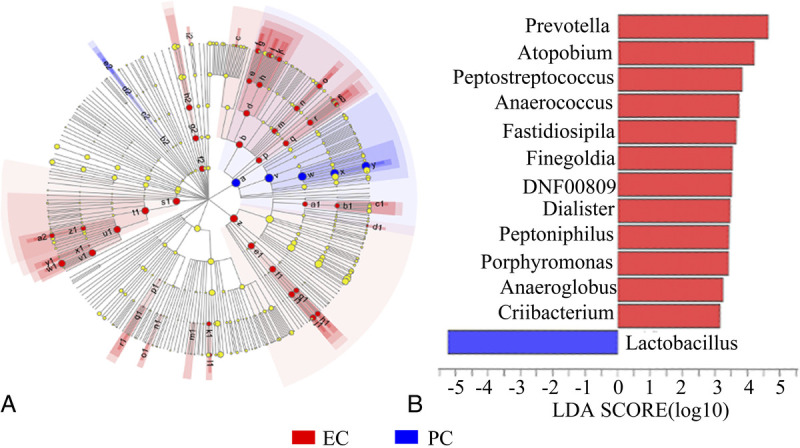
FIG. 4.

Differently abundant taxa identified using LEfSe analysis among cohorts. (A) Distribution of differently abundant taxa at the phylum (the innermost circle), class (the second circle), order (the third circle), family (the fourth circle), and genus (the outermost circle) levels between the EC and PC cohorts. The effect of the microbial taxa significantly enriched in the EC and PC cohorts on the differences between the cohorts are expressed as red and blue solid circles, respectively. Large solid circles indicate a high degree of influence of the species on the intergroup. Light yellow circles indicate that the microbial taxa had no significant effects on the differences between groups. (B) Linear discriminant analysis showing the impact of different species on the difference between EC and PC cohorts and visualization of only taxa meeting an LDA ≥3. EC, endometrial cancer; LDA, linear discriminant analysis; LEfSe, linear discriminant analysis effect size; PC, pericancer.
