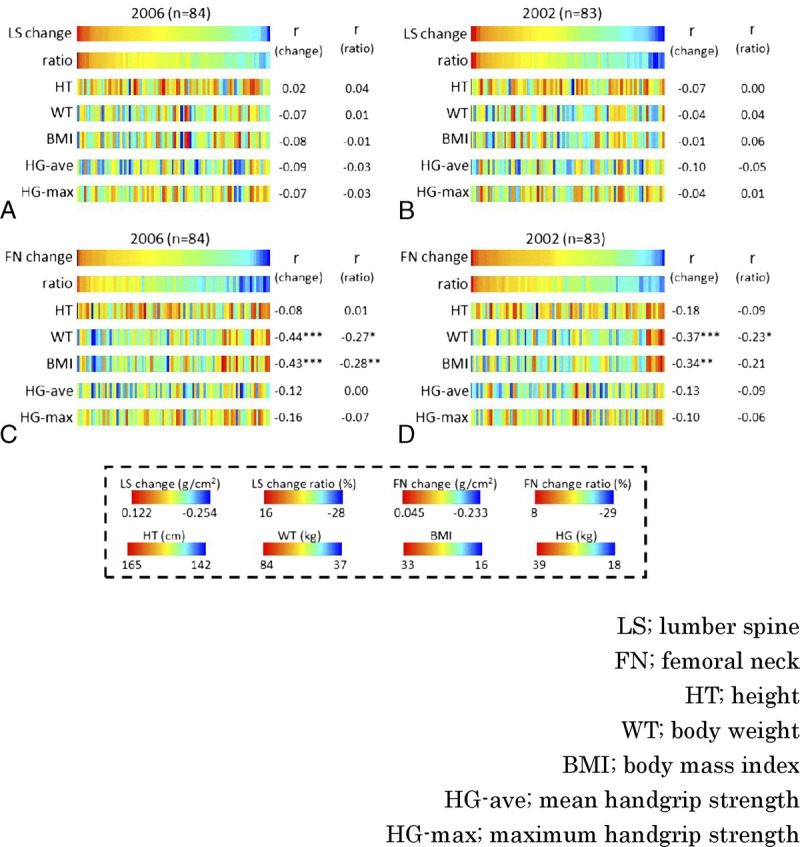
FIG. 4.

Follow-up analysis. Correlation between the amount or rate of change in BMD in women aged 50 to 54 years after 9 or 10 years and HT, WT, BMI, HG-ave, and HG-max at BMD measurement in women aged 50 to 54 years. (A) Sorted by the amount of change in LS from 2006 to 2016 (n = 84). (B) Sorted by the amount of change in LS from 2002 to 2011 (n = 83). (C) Sorted by the amount of change in FN from 2006 to 2016. (D) Sorted by the amount of change in FN from 2002 to 2011. Correlation with the amount or rate of change showed that women with heavier WT and larger BMI had a larger decrease in FN BMD. r, Pearson correlation coefficient. BMD, bone mineral density. *P < 0.05, **P < 0.01, ***P < 0.001.
