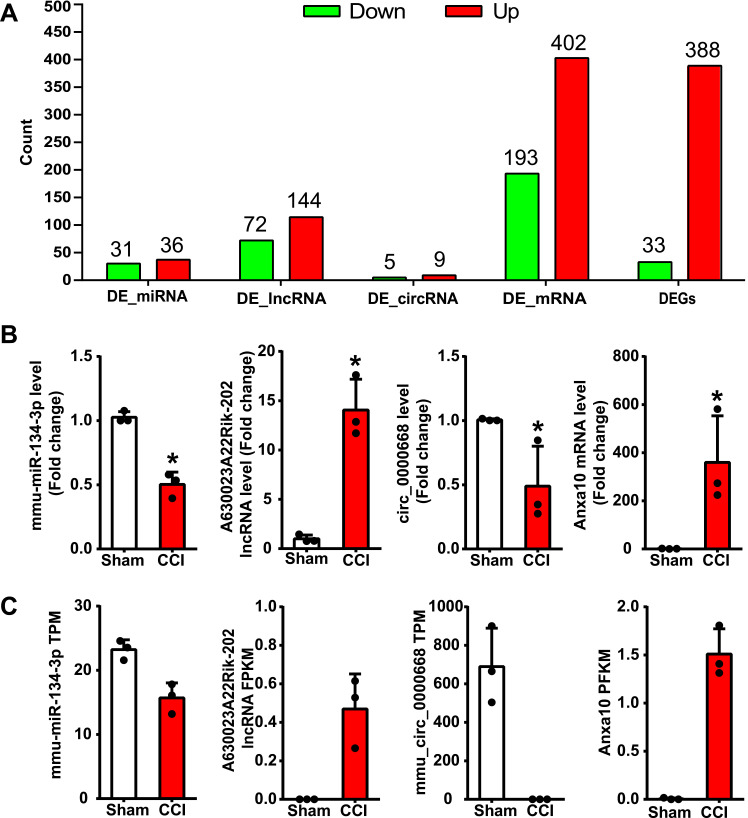
Figure 6.
Summary of DE ncRNAs, DE mRNAs, and DEGs in the TG of CCI-ION mice and RT-qPCR validation of RNA-seq results. (A) The histogram shows the number of down and up-regulated lncRNAs, circRNAs, miRNAs, and genes encoding mRNAs. (B) RT-qPCR validation of the expression level of randomly chosen DE miRNA, DE lncRNA, DE circRNA, and DE mRNA in the TG of male mice, *P< 0.05, n = 3. (C) The expression level of chosen DE miRNA, DE lncRNA, DE circRNA, and DE mRNA by RNA sequencing.

