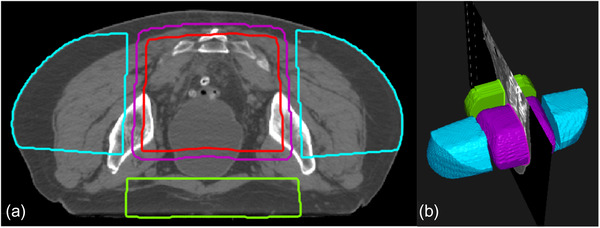
FIGURE 4.

The figure shows an example of the constructed volumes for the experimental setup. The purple volume is the region of high dose, the red volume is pseudo‐region of interest (ROI), the blue volumes are LTRT, and the green volume shows APPA. Part (a) shows a transverse slice, and (b) shows a three‐dimensional view of the volumes.
