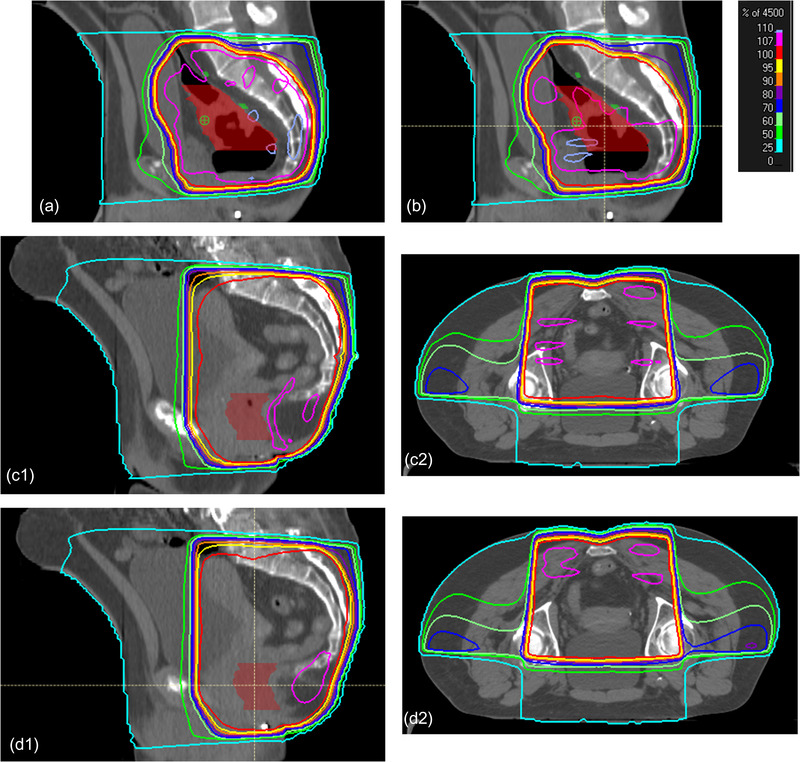
FIGURE 7.

Plans with scores from 2 to 5: Part (a) scores 2 because of large 107% volume almost covering the entire planning target volume (PTV) area, part (b) scores 3 because the 107% hotspot was still large, but the plan could be improved by adding an additional subfield, part (c) scores 4 because there was too much 107% volume in the bowel region. Manually lowering the normalization would allow a score of 5. Parts (c1 and c2) are sagittal and transverse views of the same plan. Part (d) scores 5 with minimal hotspot located in the muscle region. Parts (d1 and d2) are sagittal and transverse views of the same plan.
