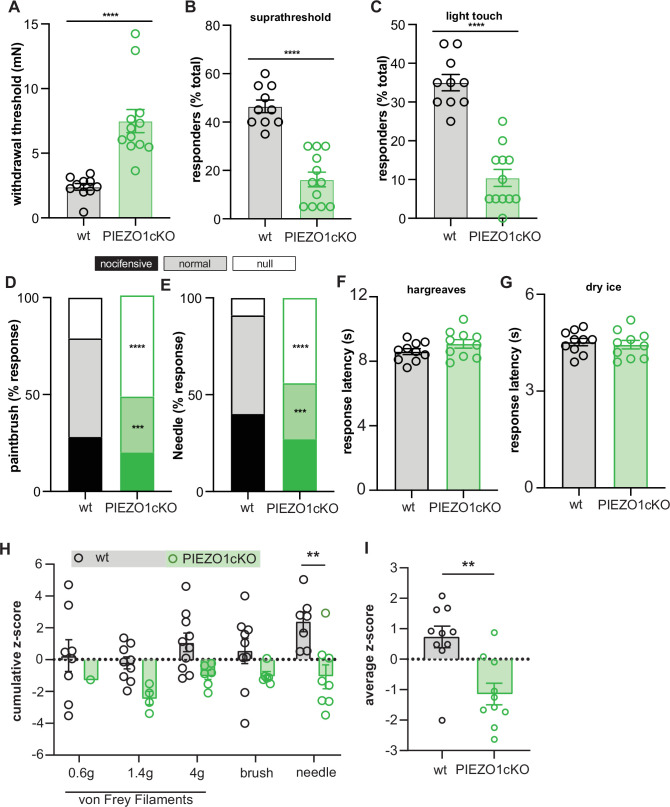
Figure 5. Epidermal Piezo1 is required for normal innocuous and noxious mechanosensation.
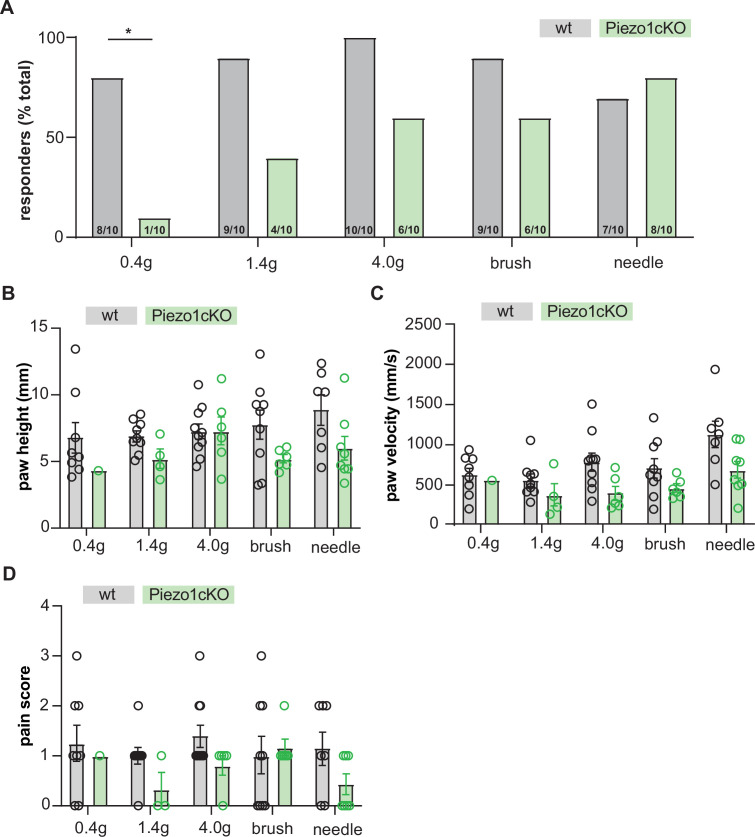
(A) Von Frey mechanical thresholds of wildtype and PIEZO1cKO mice; Mann-Whitney U-test. (B) Wildtype and PIEZO1cKO responses to repeated suprathreshold (3.61 mN) von Frey filament stimulation; Mann-Whitney U-test. (C) Wildtype and PIEZO1cKO responses to repeated static light touch (0.6 mN von Frey filament) stimulation; Mann-Whitney U-test. (D) Response characterization to paintbrush swiping across hindpaw; n=10–12; bars are group averages; Chi Square test. (E) Response characterization to noxious needle hindpaw stimulation; n=10–12; bars are group averages; Chi Square test. (F) Withdrawal latency to radiant heat hindpaw stimulation; Student’s (two-tailed) t test, n.s. (G) Withdrawal latency to dry ice hindpaw stimulation; Student’s (two-tailed) t test, n.s. (H) High-speed imaging mechanical sensitivity scores in response to von Frey (0.6 g, 1.4 g, 4 g), brush, and needle stimulation in wildtype and PIEZO1cKO mice; two-way ANOVA . Cumulative z-scores were calculated from paw height, paw velocity, and pain score at each stimulus. (I) Average high-speed imaging mechanical sensitivity score across all stimuli for each animal. All data are mean ± SEM unless otherwise stated. Post-hoc comparisons for all panels: **p<0.01, ***p<0.001, ****p<0.0001.


