. 2022 Sep 8;11:e80332. doi: 10.7554/eLife.80332

Figure 2. hFip1 directly recruits poly(A) polymerase.

(A) Polyadenylation activity assay of mPSF complexes containing wild-type and mutant CPSF30 proteins as well as hFip1 added in trans (rightmost lane) using a Cy5-labeled PAS-containing RNA substrate. An RNA substrate lacking the canonical AAUAAA PAS hexanucleotide is denoted by its substitute sequence, AGUACA. Polyadenylated RNA products are indicated as RNA-(A)n. (B) Pull-down analysis of immobilized StrepII-tagged mPSF complexes comprising N-terminal truncations of hFip1 with GFP-PAP. GFP-PAP is visualized by in-gel GFP fluorescence (bottom). Asterisk denotes contaminating protein. (C) Polyadenylation activity assay of mPSF complexes containing hFip1 truncations. (D) Size-exclusion chromatography coupled to multiangle static light scattering (SEC-MALS) analysis of reconstituted mPSF:PAP:RNA complexes and in the absence (purple) or presence of excess PAP (yellow). Theoretical molecular masses of 1:1 and 1:2 mPSF:PAP complexes are indicated.

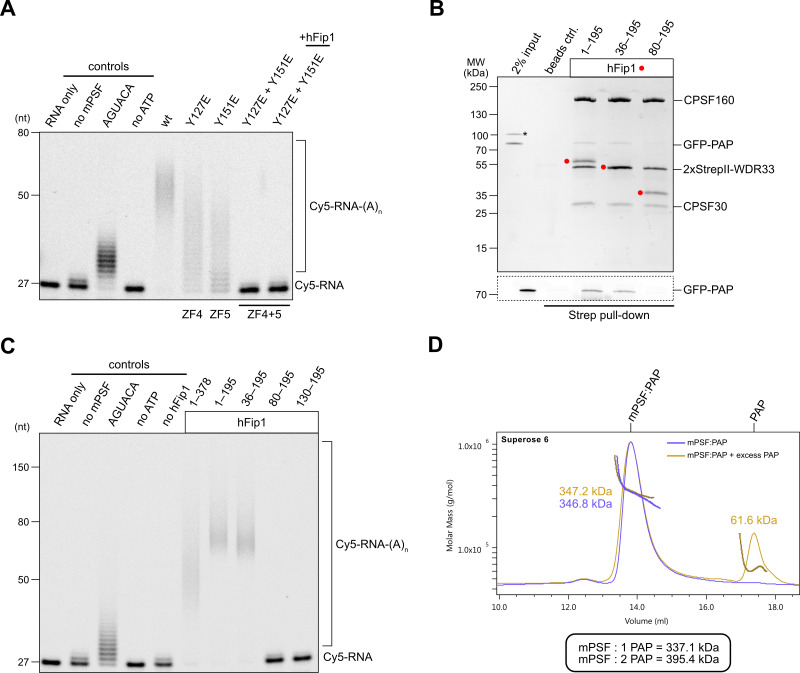
Figure 2—source data 1. Raw gel image for Figure 2, panel A.
Figure 2—source data 2. Raw gel image for Figure 2, panel A.
Figure 2—source data 3. Raw gel image for Figure 2, panel B.
Figure 2—source data 4. Raw gel image for Figure 2, panel B.
Figure 2—source data 5. Raw gel image for Figure 2, panel C.
Figure 2—source data 6. Raw gel image for Figure 2, panel C.

Figure 2.

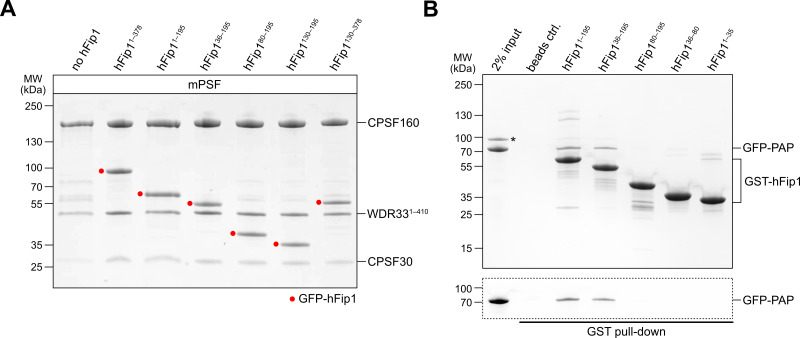
Figure 2—figure supplement 1. Analysis of hFip1 regions required for PAP recruitment.

Figure 2—figure supplement 1.

(A) Purified mPSF complexes containing hFip1 isoform 4 and truncations thereof (indicidated with red dots) used in polyadenylation activity assay (Figure 2C). (B) Pull-down assay of immobilized glutathione-S-transferase (GST)-tagged hFip1 fragments with GFP-PAP. GFP-PAP is visualized by in-gel GFP fluorescence (bottom). Asterisk denotes protein contaminant.
Figure 2—figure supplement 1—source data 1. Raw gel image for Figure 2—figure supplement 1, panel A.
Figure 2—figure supplement 1—source data 2. Raw gel image for Figure 2—figure supplement 1, panel A.
Figure 2—figure supplement 1—source data 3. Raw gel image for Figure 2—figure supplement 1, panel B.