. 2022 Sep 8;11:e80332. doi: 10.7554/eLife.80332

Figure 3. hFip1 interacts with CstF77 through a conserved motif within its N-terminal acidic domain.

(A) Pull-down analysis of immobilized GST-hFip1 fragments with MBP-CstF7721–549. (B) Cartoon representation of the crystal structure of the CstF77241–549–hFip11–35 complex, superimposed onto the structure of murine CstF77 (white, PDB ID: 2OOE). (C) Zoomed-in view of the hFip1–CstF interaction interface. (D) Multiple sequence alignment of the N-terminal region of Fip1 orthologs. (E) Pull-down analysis of immobilized wild-type and mutant GST-hFip11–35 proteins with MBP-CstF7721–549 and MBP-CstF77mut (R395A/R402A/K431A). Asterisk indicates contaminating free GST protein. (F) 3D cryo-EM density map (EMD-20861) of the human CPSF160–WDR33–CPSF30–PAS RNA–CstF77 complex (Zhang et al., 2019), displayed at contour level 0.015 and color coded according to the corresponding atomic protein model (PDB ID 6URO). The hFip1–CstF77 crystal structure from this study was superimposed onto the atomic model of CstF77, and atomic model of hFip1 is shown (cyan). Inset shows a zoomed-in view of unassigned density that matches hFip1.

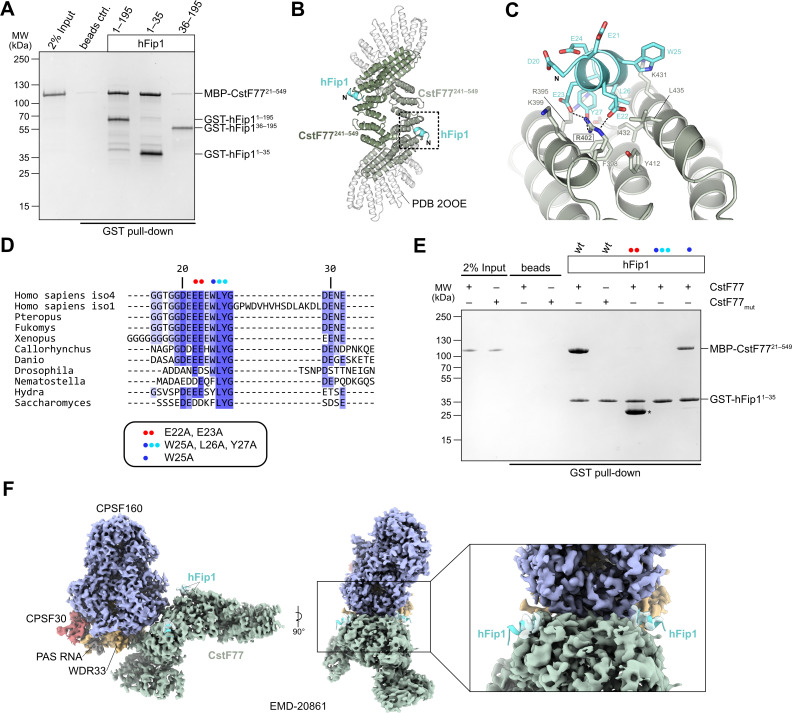
Figure 3—source data 1. Raw gel image for Figure 3, panel A.
Figure 3—source data 2. Raw gel image for Figure 3, panel E.

Figure 3.

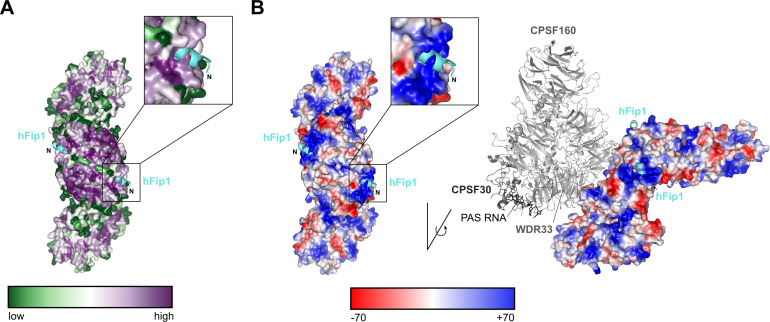
Figure 3—figure supplement 1. hFip1 binds to a conserved positively charged patch on CstF77.

Figure 3—figure supplement 1.

(A) Color-coded representation of surface conservation of CstF77. Cartoon representation of bound hFip11–35 (cyan). Inset shows a zoomed-in view of the sequence conservation of CstF77 surrounding at the Fip1-binding site. (B) Color-coded electrostatic surface representation of CstF77 HAT homodimer alone (left) or bound to mPSF (right), both with hFip1 (cyan) shown in cartoon representation. Inset shows a zoomed-in view of the CstF77 surface electrostatics at the hFip1-binding site.
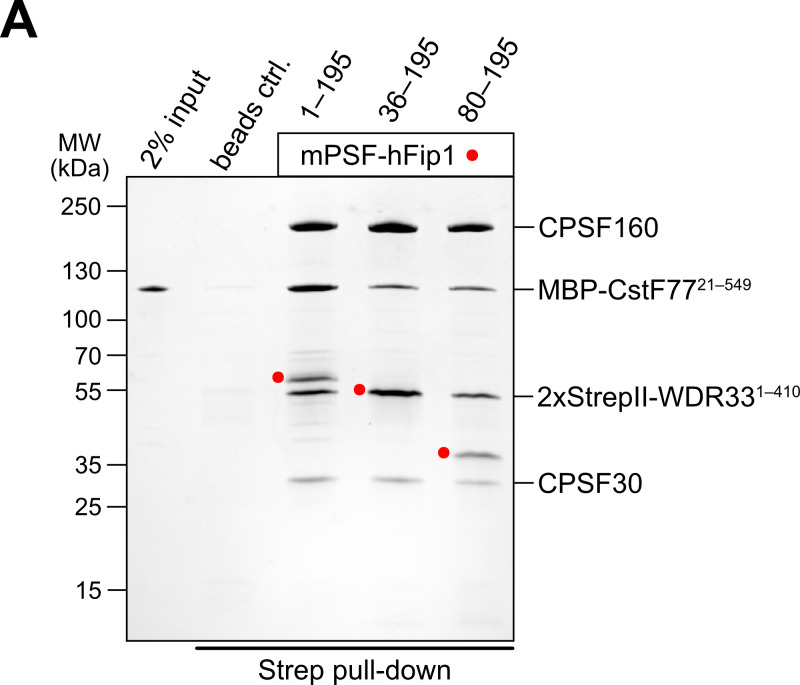
Figure 3—figure supplement 2. The N-terminal region of hFip1 contributes to mPSF–CstF77 interaction.

Figure 3—figure supplement 2.

(A) Pull-down analysis of immobilized StrepII-tagged mPSF complexes containing N-terminally truncated hFip1 proteins with MBP-CstF77 HAT domain.
Figure 3—figure supplement 2—source data 1. Raw gel image for Figure 3—figure supplement 2, panel A.
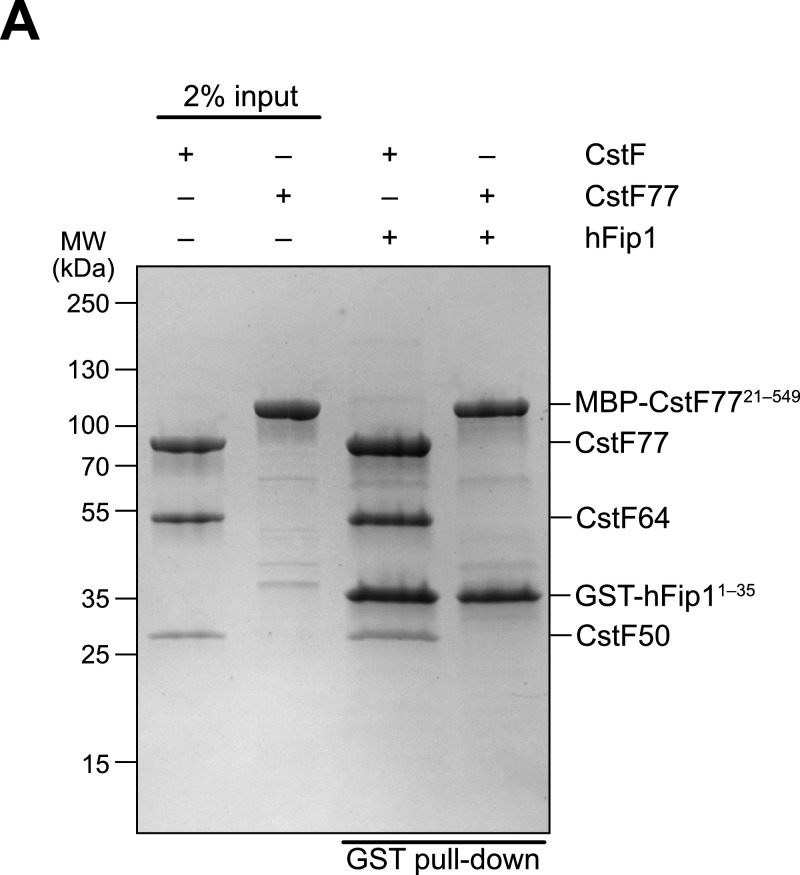
Figure 3—figure supplement 3. The N-terminal region of hFip1 interacts with CstF complex.

Figure 3—figure supplement 3.

(A) Pull-down analysis of immobilized GST-tagged hFip11–35 with holo-CstF complex.
Figure 3—figure supplement 3—source data 1. Raw gel image for Figure 3—figure supplement 3, panel A.