FIGURE 3.

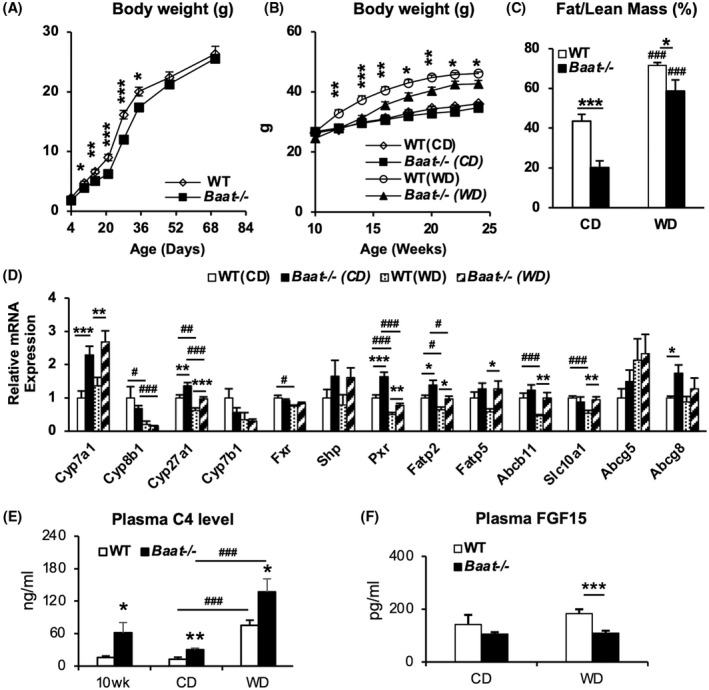
Compromised body weight gain in Baat −/− mice on high‐fat feedings. Table 1 is also associated with the Figure 3. (A) Newborn pups from heterozygous mating were monitored for their body weight gain from 4 days to 10 weeks. Average body weights were presented with SEM (n = 9–10). (B) Ten‐week‐old WT and Baat −/− mice were fed a Western diet (WD) containing high cholesterol for 15 weeks. Their biweekly body weights were plotted with means ± SEM (n = 7–11). (C) Body fat and lean mass were measured at 2 days before euthanasia for tissue collection without fasting. The ratio of fat to lean mass in each group was plotted with means ± SEM (6 WT chow [WTC], 5 knockout chow diet [KOC], 11 WT WD [WTWD], and 11 knockout WD [KOWD]). (D) Total RNA was extracted from liver and the indicated messenger RNA (mRNA) levels were quantified by real‐time quantitative PCR analysis after normalization to glyceraldehyde 3‐phosphate dehydrogenase (Gapdh) level. Average level relative to WTC was plotted with ±SEM (n = 7–9). (E) Plasma 7α‐hydroxy‐4‐cholesten‐3‐one (C4) levels of experimental animals (n = 6 per group; 10‐week‐old fed chow groups and 25‐week‐old WD regimen groups) were quantified using ultrahigh‐performance liquid chromatography–tandem mass spectrometry (UPLC‐MS/MS). Their means ± SEM were presented as a bar graph; *between genotypes; #between chow diet (CD) and WD. (F) Plasma FGF15 concentrations in the WT and Baat −/− mice on the WD regimen were measured using a commercial enzyme‐linked immunosorbent assay kit (n = 6 WTC, 6 KOC, 12 WTWD, and 11 KOWD).
