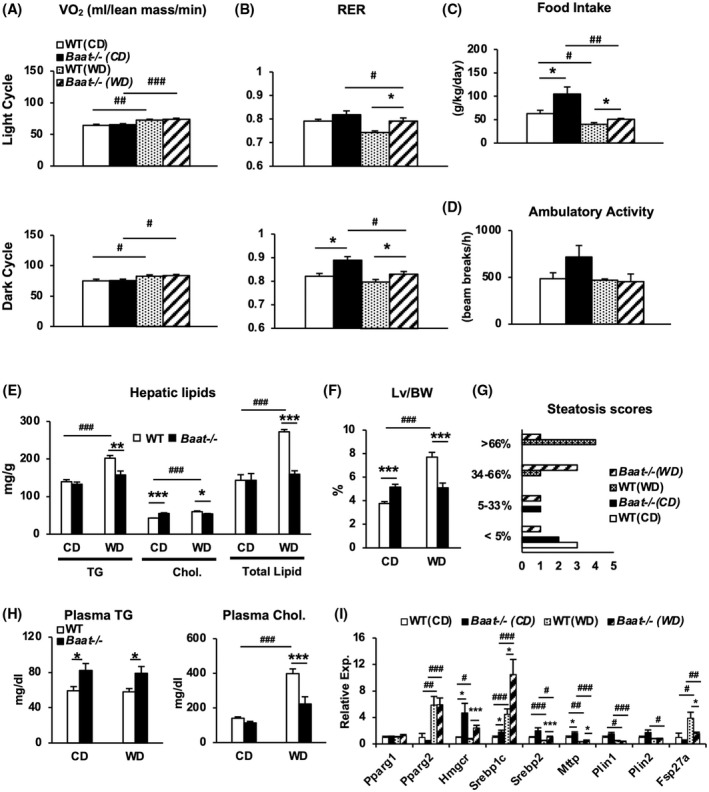
FIGURE 4.

Comprehensive lab animal monitoring system (CLAMS) analysis and liver assessment on Baat −/− mice fed WD. (A–D) Oxygen consumption (VO2) (A), respiratory exchange ratio (RER) (B), food intake (C), and ambulatory activity (D) were measured using CLAMS. Average values of dark or night cycle from each group are presented with ±SEM for VO2 and RER. All measurements were from 23–24‐week‐old mice on CD (n = 7 and 9) or WD (n = 5 and 7). (E) Triglycerides (TG), cholesterol, and total lipid were measured from livers of mice fed CD or WD. Their average values are presented with ±SEM. (F) Liver (Lv)–to–body weight (BW) ratios from each group. (G) Steatosis scores were blindly evaluated by a pathologist (Dr. Novak) from hematoxylin and eosin–stained liver sections. The x‐axis represents the number of liver sections obtained from WT and Baat −/− mice, and y‐axis represents steatosis percentages (n = 5 per each group). (H) Plasma TG and plasma cholesterol levels were quantified in the experimental animals and are plotted as means ± SEM. (I) Expression of hepatic genes in lipid and cholesterol synthesis was quantified using quantitative PCR analysis. Relative expression to WTCD was is as means ± SEM (n = 13–15; Student's t test; *between genotypes; #between CD and WD). Fsp27a, fat‐specific protein 27a; Hmgcr, 3‐hydroxy‐3‐methyl‐glutaryl‐coenzyme A reductase; Mttp, mitochondria triglyceride transport protein gene; Pparg, peroxisome proliferator‐activated receptor gamma; Srebp, sterol regulatory element binding protein.
