FIGURE 5.

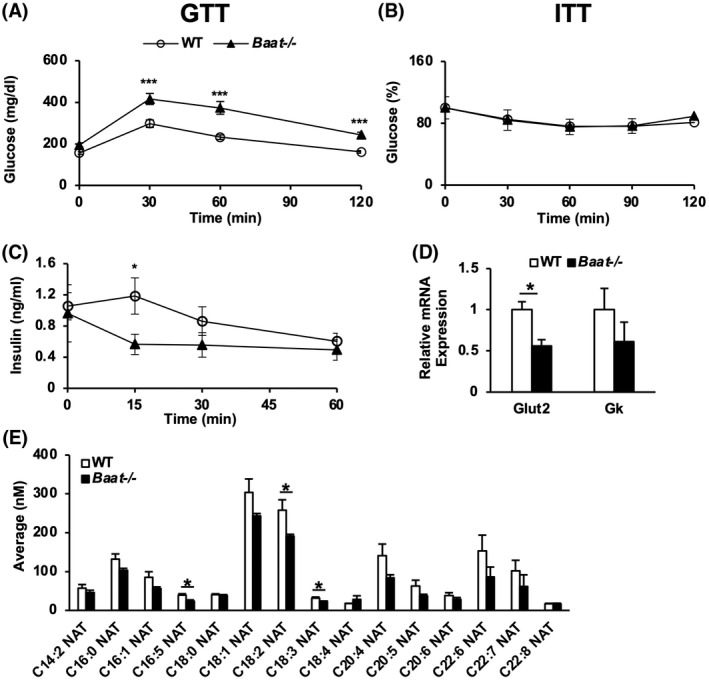
Disrupted glucose homeostasis of Baat −/− mice. (A) Glucose tolerance test (GTT) was performed on 19‐week‐old mice fed WD with intraperitoneal (i.p.) injection of 1 g/kg glucose after 6‐h fasting (n = 11–12). (B) Insulin tolerance test (ITT) was performed on 21‐week‐old male mice fed WD with i.p. injection of 1 U/kg Humulin after 6‐h fasting. Percentage values relative to zero time points re plotted with means ± SEM (n = 6–9). (C) Plasma insulin level was quantified with blood samples collected at 0 min, 15 min, 30 min, and 60 min during the GTT. Average raw values are plotted with SEM. (D) Expression of genes involved in the insulin secretion was quantified from the pancreatic islets of the animals on WD. (E) N‐acyl taurines were quantified in plasma of 10‐week‐old Baat −/− and WT mice using LC/MS‐MS (n = 6–7).
