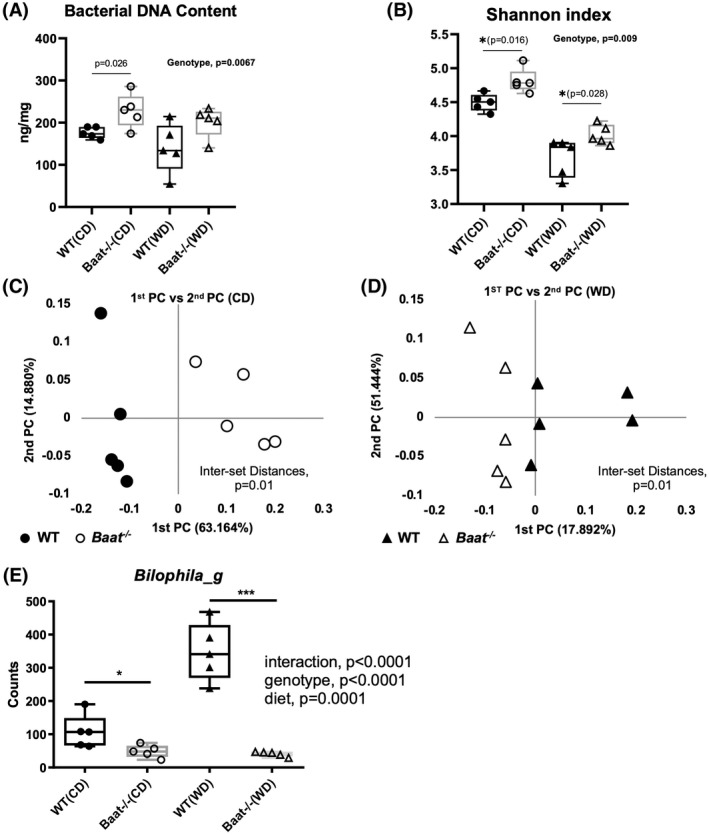
FIGURE 6.

Altered gut microbiome in Baat −/− mice. (A) Total bacterial DNA content in the cecum was measured in Baat −/− mice and WT on both diets. The DNA content normalized by cecal weight is presented as a box‐and‐whisker graph using GraphPad Prism. (B) Alpha diversity of the gut microbiota from CD and WD groups are presented with Shannon indices. (C,D) Principle coordinate (PC) analysis of species‐level taxonomy was performed and plotted for CD (C) and for WD (D) groups using Unifrac. (E) Abundance of the genus Bilophila, a sulfidogenic bacterium, is presented as normalized by 16S RNA copy numbers. Two‐way analysis of variance was used to obtain the statistics.
