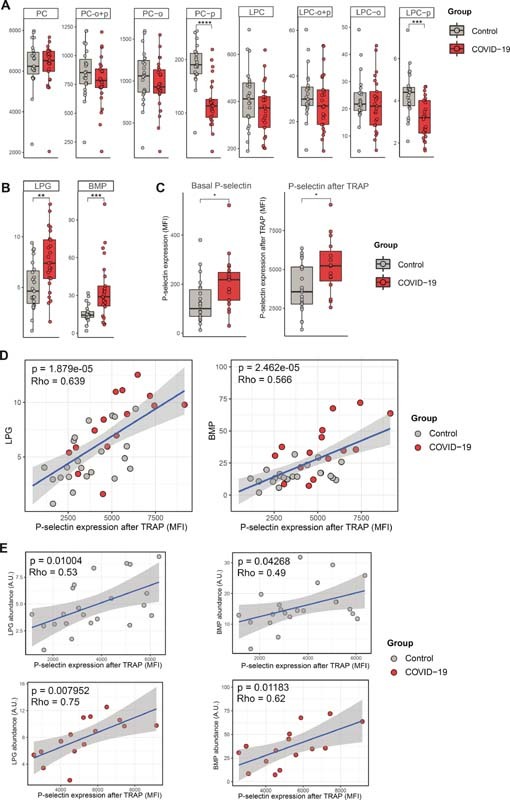
Fig. 2.

Class-wide lipidomic changes in COVID-19 and correlation with platelet reactivity. ( A ) Boxplots showing the median and interquartile ranges of PC and LPC subclasses. Each point shows the aggregated values per lipid class (a sum of all lipids per class) per subject, thus each point represents an individual. Values on the y -axis are semiquantitative lipid abundance (arbitrary unit, A.U). A p -value below 0.05 was considered significant after a Wilcoxon-ranked sum test. ( B ) Boxplots of LPG and BMP lipid classes. ( C ) Boxplots showing P-selectin expression (in MFI) on platelets in the basal state or after stimulation with TRAP, comparing patients with COVID-19 and matched controls. For both boxplots, a p -value below 0.05 was considered significant after a Wilcoxon-ranked sum test. * p -value < 0.05. ( D ) Scatterplots showing the correlation between aggregated LPG (left) and BMP (right) levels and platelet P-selectin expression (in MFI) after stimulation with TRAP. Values on the y -axis are semiquantitative lipid abundances (arbitrary unit, A.U). The strength of the correlation is depicted as Spearman's rho. ( E ) Same as in panel (D), but now split between controls and patients. BMP, bis(monoacylglycero)phosphate; LPC, lysophosphatidylcholine; LPG, lysophosphatidylglycerol; MFI, median fluorescence intensity; PC, phosphatidylcholine.
