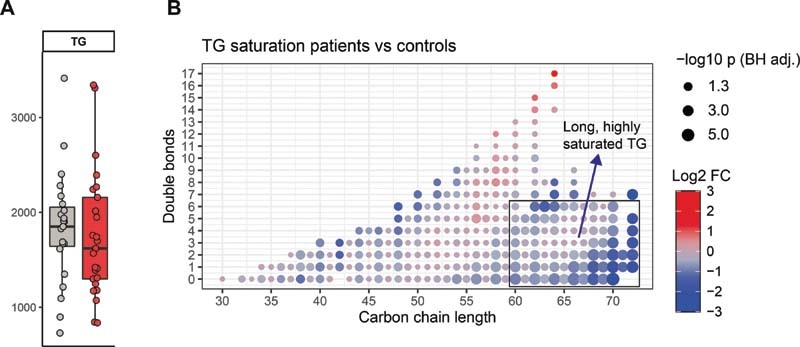
Fig. 3.

Decrease of long-chain, highly saturated triacylglycerol in COVID-19 platelets. ( A ) Boxplot of the TG class. ( B ) Dot plot of TG differences between patients with COVID-19 and controls. Each dot is a TG species. The color of the dots indicates the log2-fold change between the groups, the size of the dot is proportional to the Benjamini–Hochberg adjusted −log10 p -value of this change. The X -axis indicates the carbon chain length, and the Y -axis shows the amount of double bonds in the lipid.
