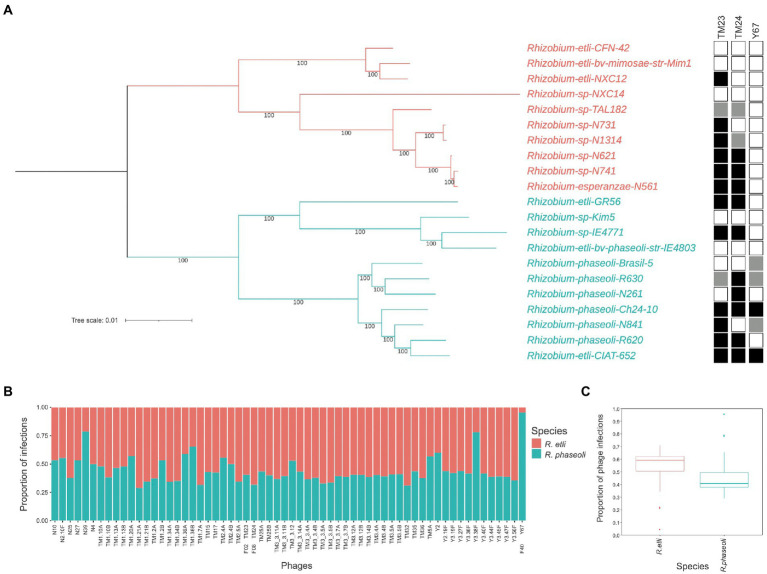
Figure 2.
Host infection range of Rhizobium microvirus. (A) Maximum likelihood unrooted tree with the common core genome of R. etli and R. phaseoli strains and the infection by TM23, TM24, and Y67 in spot-assays. Black squares indicate complete lysis; gray, partial lysis; and empty squares, absence of lysis. (B) The proportion of infection of 63 microviruses on R. etli and R. phaseoli strains. (C) Box plots of the proportion of phage infections on the two Rhizobium species with the median and the quartile distribution. Data on infection for B and C were extracted from the phage-bacteria infection matrix reported in (Van Cauwenberghe et al., 2021, “Dataset 1”).

