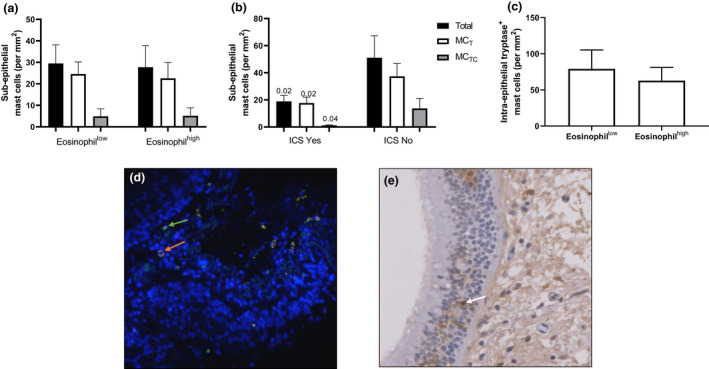
Figure 4.

Mast cell quantification in bronchial biopsies. The number of subepithelial tryptase+ (MT), tryptase+chymase+ (MTC) and the total number of mast cells (MT + MTC) were quantified by immunofluorescence (a, b) and the number of intra‐epithelial tryptase+ mast cells were quantified by immunohistochemistry (c). Representative images of immunofluorescence where green and orange arrows indicate MT and MTC cells respectively (d) and immunohistochemistry where white arrows indicate tryptase‐positive mast cells (e). Comparisons were made between eosinophillow vs eosinophilhigh patients (a) n = 10 vs n = 13; (c) n = 14 vs n = 15; ICS users vs non‐users (b) n = 16 vs n = 7. P‐values in b signify differences between the same mast cell populations in ICS Yes vs ICS No groups.
