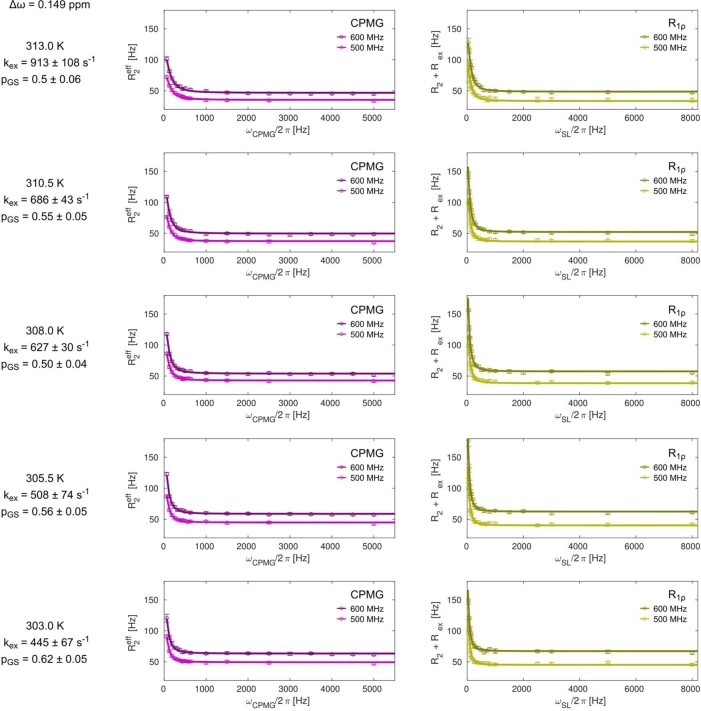
Extended Data Fig. 5. Temperature dependent 19F relaxation dispersion.
19F CPMG (left) and R1ρ (right) relaxation dispersion of CtXrn2 1-875 ΔZnF N12CBTFA at temperatures between 303 K and 313 K and 1H Larmor frequencies of 500 MHz and 600 MHz. Fit parameters of the global fit and separate fits of CPMG and R1ρ datasets are included in Table S6. Note that the R1ρ data contains more datapoints at low frequencies. In the CPMG experiments the number of possible frequencies is determined by the relaxation delay and can only be a multiple of 1 / Trelax = 62.5 Hz (for the Trelax of 16 ms that was used). The R1ρ experiment, on the other hand, can use arbitrary spin-lock frequencies and is thus able to sample the RD curve at low frequencies better. Note that very low spinlock frequencies cannot be used in R1ρ experiment, as then the signal decay is no longer mono-exponential. The extracted fitting parameters, including errors are summarized in Supplementary Table 6. Data points are shown as mean ± s.d., as derived from 3 duplicate NMR measurements.

