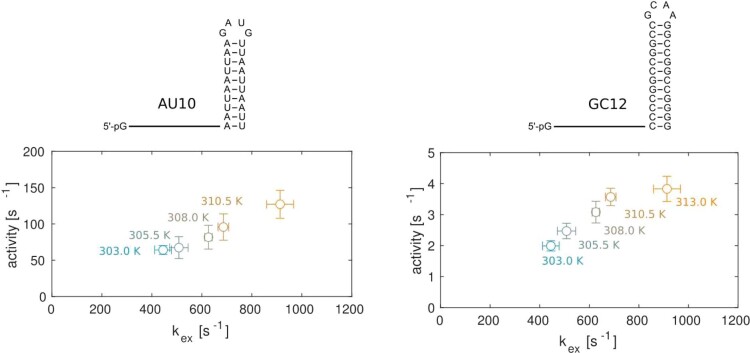
Extended Data Fig. 6. The exchange rate kex is linearly correlated with the activity in the Xrn2.
The activity (turnover rate) and exchange rates (kex) were measured with an Xrn2 ΔZnF N12C-BTFA sample. Activities are derived from HPLC assays, exchange rates are derived from the global fit of 19F relaxation dispersion data (Fig. 3E). The linear correlation between kex (kex = kGS-ES + kES-GS) and turnover rates suggests that the exchange and degradation rates are functionally linked. In the apo-state of the enzyme, the population of the excited (active) state is between 20 and 50%. The forward rate (kGS-ES) is thus between 0.2*kex and 0.5*kex. For a 20% excited state the kGS-ES rates (as measured) in the apo-enzyme correlate directly with the turnover rate (activity) of the AU10 RNA, indicating that the translocation of the substrate from the pre-translocation state II to the active state is rate limiting during the catalytic cycle. The degradation rates of RNAs with a stable GC stemloop structure (GC12 RNA) is considerably slower, as the rate limiting step in the catalytic cycle moves from the dynamics in the N-terminal helix to the time it takes to melt the secondary structure in the RNA substrate. Data points are shown as mean ± s.d. The errors in the activities are derived from 2 to 4 independent experiments; the errors in the rates are derived from 500 MC simulations (Extended Data Fig. 5, Supplementary Figs. 12 and 13 and Table S6).

