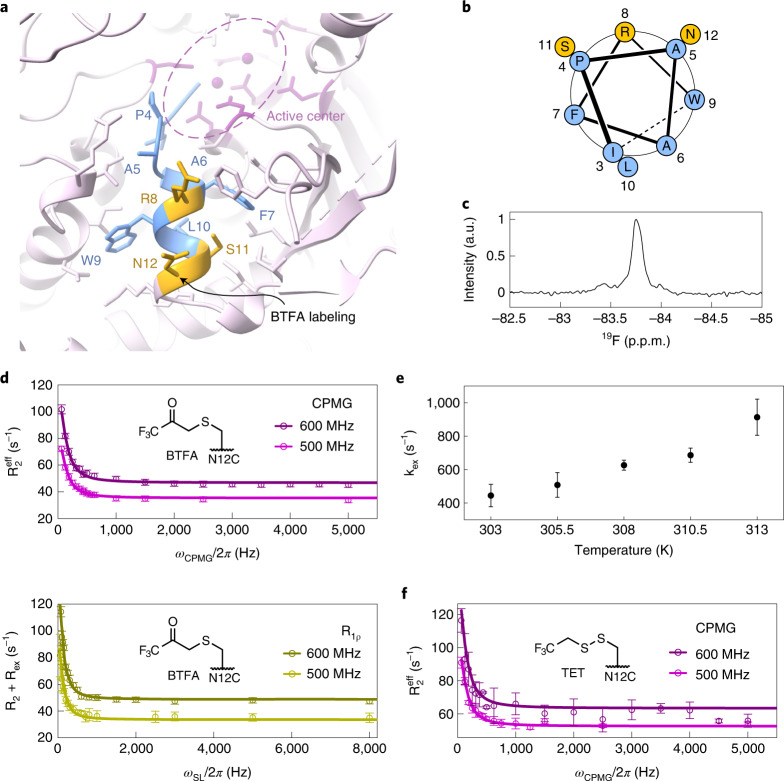
Fig. 3. 19F NMR supports the sampling of an excited conformational state by the α1-helix.
a, Close-up view of the α1-helix, where the mutation N12C was introduced to allow for BTFA labeling. Hydrophobic residues are shown in blue; charged and polar solvent-exposed residues are shown in yellow. b, Helical wheel projection for residues 3–12 in the α1-helix. Coloring as in a. c, 19F NMR spectrum of Xrn2 ΔZnF N12CBTFA. d, CPMG and on-resonance R1ρ dispersion profiles for Xrn2 ΔZnF N12CBTFA samples recorded at 500 MHz and 600 MHz 1H frequency at 313 K. Data points are shown with error bars derived from multiple measurements; lines show the best fit derived from the simultaneous analysis of all datasets from five temperatures with one global | Δω | . At 313 K, this yielded: pGS = 0.50 ± 0.06; kex = 913 ± 108 s−1; and | Δω | = 0.15 ± 0.01 p.p.m. (Supplementary Table 6). Data points are shown as mean ± s.d., derived from three duplicate NMR measurements. e, Correlation between the exchange rate (kex) and the temperature. Note that the recording of the 19F relaxation data is considerably faster than the recording of the 13C data, as the latter depends on a series of 2D NMR spectra. Data points are shown as mean ± s.d., derived from 500 Monte Carlo simulations (Extended Data Fig. 5, Supplementary Figs. 12 and 13 and Supplementary Table 6). f, CPMG dispersion profiles of Xrn2 ΔZnF N12CTET at 11.7 T (500 MHz 1H frequency) and 14.1 T (600 MHz 1H frequency) at 313 K. The data were fit with the population pGS = 50% and the exchange constant kex = 913 s−1 obtained from analysis of the BTFA data. Data points are shown as mean ± s.d., derived from three duplicate NMR measurements. a.u., arbitrary unit.

