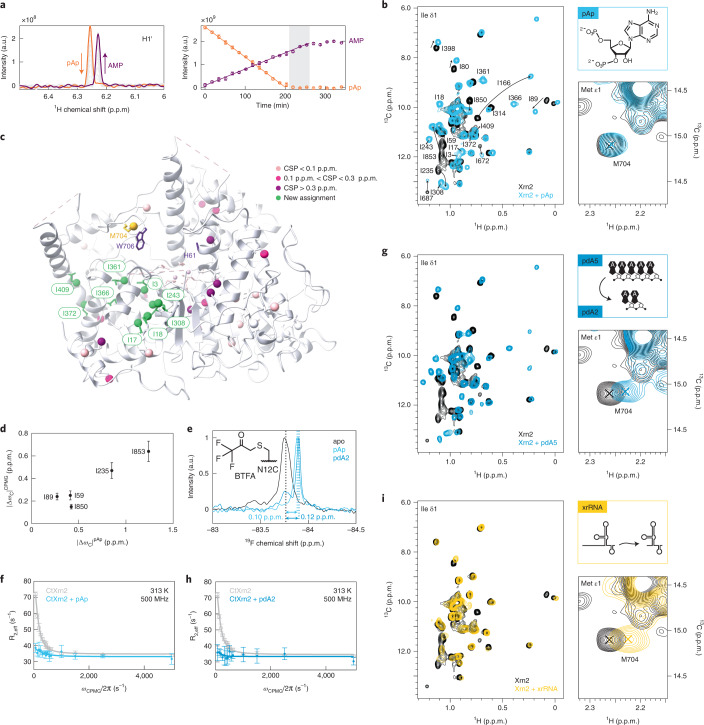
Fig. 4. Substrate binding induces a conformational change to a more rigid Xrn2 state.
a, Left: 1H NMR spectrum showing the H1' resonance of pAp (orange) and AMP (purple). Right: linear fit of the integrated peak intensities reveals a turnover rate of 0.05 min−1. Data points are shown as integrated peak intensities; error bars represent spectral noise. b, Overlay of methyl-TROSY spectra in the absence (black) and presence (light blue) of pAp. Binding of pAp leads to strong CSPs; the M704 resonance remains almost unperturbed. c, Ile-δ1 methyl groups in Xrn2 that could only be assigned in the pAp-bound state are colored green. Ile-δ1 resonances were colored according to the amplitude of the CSP. H61, W706 and M704 are shown as sticks. d, Correlation of 13C CSPs obtained upon binding of pAp and | Δω13C | extracted from the CPMG data (Fig. 2c). Data points are shown as mean ± s.d., derived from 500 Monte Carlo simulations (Extended Data Fig. 7 and Supplementary Table 6). e, 19F NMR spectra of Xrn2 ΔZnF N12CBTFA without ligand (black) and bound to pAp (light blue) or pdA5 (dark blue). Upon interaction with the substrates, the 19F line width is reduced from 55 Hz to 36 Hz (pAp) and 32 Hz (pdA5), respectively. f, CPMG RD profiles of Xrn2 ΔZnF N12CBTFA in the absence (gray) and presence (light blue) of pAp. Data points are shown as mean ± s.d., derived from three duplicate NMR measurements. g, Overlay of methyl-TROSY spectra in the absence (black) and presence (dark blue) of pdA5 (that is degraded to pdA2). CSPs are observed in the Ile region; M704 experiences a characteristic shift in the 1H dimension. h, CPMG RD profiles of Xrn2 ΔZnF N12CBTFA in the absence (gray) and presence (dark blue) of pdA5/pdA2. Data points are shown as mean ± s.d., derived from three duplicate NMR measurements. i, Overlay of methyl-TROSY spectra in the absence (black) and presence (yellow) of an xrRNA. The shift of M704 as well as Ile-δ1 CSPs close to the active site and the RNA entry site show that the complex is locked in the pre-translocation conformation. a.u., arbitrary unit.

