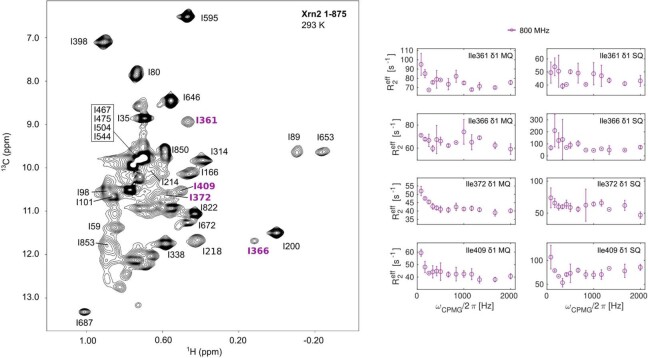
Extended Data Fig. 3. 1H-13C methyl TROSY spectrum of Xrn2 at 293 K and exemplary CPMG RD curves.
Methyl TROSY NMR spectrum of Xrn2 recorded at 293 K. Resonances that could only be assigned at 293 K are indicated in magenta. At 313 K these resonances could not be assigned due to strong exchange broadening. The residues that appear at 293 K display elevated relaxation rates at lower CPMG frequencies in both 13C SQ and 1H-13C MQ CPMG RD experiments. Due to overall enhanced relaxation and increased peak overlap at 293 K, a faithful fit of the CPMG RD data could not be reliably performed at the lower temperature. Data points are shown as mean ± s.d., as derived from 2 duplicate NMR measurements.

