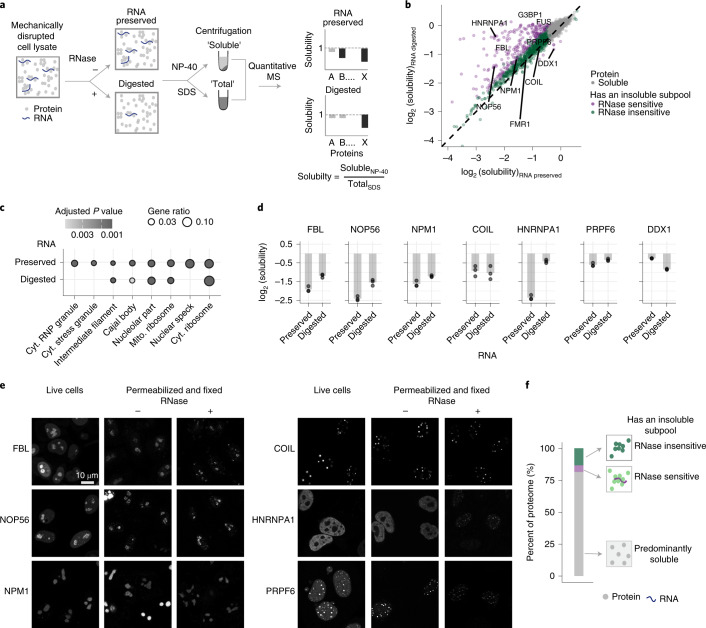
Fig. 1. Solubility status of the human proteome.
a, Experimental setup of solubility proteome profiling using RNA-preserved and RNA-digested crude cellular lysate systems. b, Scatterplot comparing the solubility (NP-40/SDS ratio) of proteins in RNA-preserved (x axis) and RNA-digested (y axis) samples in log2 scale. Proteins that maintain a significant insoluble subpopulation (see Methods for statistical significance) in both lysate types are depicted in green and proteins that alter solubility due to cellular RNA digestion are shown in purple. FMR1, fragile X messenger ribonucleoprotein 1; G3BP1, G3BP stress granule assembly factor 1. c, Dot plot showing a subset of over-represented gene ontology cellular compartment terms (q value < 0.05, hypergeometric test, corrected using the Benjamini–Hochberg procedure) among proteins that exhibit low solubility in RNA-preserved and RNA-digested lysates. Cyt., cytosolic; mito., mitochondrial. d, Bar plot representation of solubility (y axis in log2 scale) of FBL, NOP56, NPM1, COIL, HNRNPA1 and PRPF6 in RNA-preserved and RNA-digested (x axis) samples. Dots represent the solubility measurement from three independent biological replicates. Low FCs represent low solubility. e, Confocal microscopy images of HeLa cells overexpressing fusion proteins GFP–FBL, GFP–NOP56, SiR-SNAP–NPM1, GFP–COIL, GFP–HNRNPA1 and GFP–PRPF6 in live cells and in permeabilized (without and with RNase treatment) and fixed cells. f, Bar plot representing different solubility classes of proteins. Proteins are classified as ‘predominantly soluble’ (no significant insoluble subpool was measured) and ‘has an insoluble subpool’, which is either ‘RNase sensitive’ or ‘RNase insensitive’.

