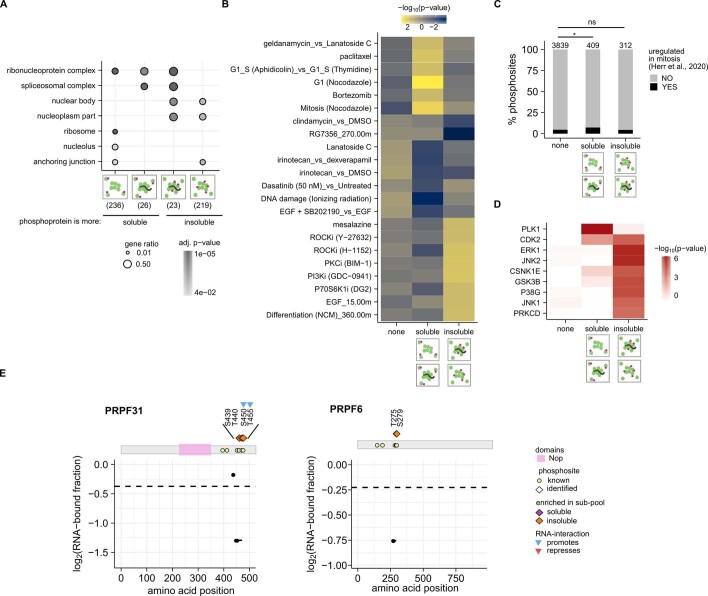
Extended Data Fig. 4. Regulation and localization of differential phosphosites.
(a) Dot plot of gene ontology cellular compartments over-represented among proteins which have differentially soluble phosphopeptides (q-val < 0.05, hypergeometric test, corrected using Benjamini-Hochberg procedure). (b) Heat map representation of the degree of regulation of phosphosites sub-divided into protein solubility subgroups across different conditions. The up or down regulation of phosphosites was inferred from a large scale collection of previously published phosphoproteomics datasets26 on various conditions including drug/inhibitor treatment and different cellular states. Cellular conditions in which the phosphosites assigned in this study showed significant change (Z-test, |-log10(p-value)| > 2) in regulation in at least one solubility subgroup are shown. High positive and negative values indicate increased or decreased regulation of phosphosites in the indicated condition. (c) Bar plot representation of the proportion of mitotically upregulated phosphorylation (from Herr et a., 2020) sites among the differentially soluble phosphosites identified from this dataset. Significance estimated using Fisher’s exact test and coded as * p-value < 0.05, ns- not significant. (d) Heat map representation of kinase over-representation analysis based on enrichment of their direct substrates in different protein solubility sub-groups. Kinases enriched in at least one protein solubility sub-group are shown (q-value < 0.15, hypergeometric test corrected with Benjamini-Hochberg procedure). (e) Visualization of the median RNA-bound fraction (n = 3) of identified phosphopeptides and unmodified protein of PRPF6 and PRPF31. Top: schematic representation of the protein with its domains and known phosphosites from Uniprot is shown. Median RNA-bound fraction (of three independent measurements, y-axis) of phosphopeptides (solid lines with points representing the site) and unmodified protein (dotted line) in log2 scale is represented along the linear sequence of the protein (x-axis).

