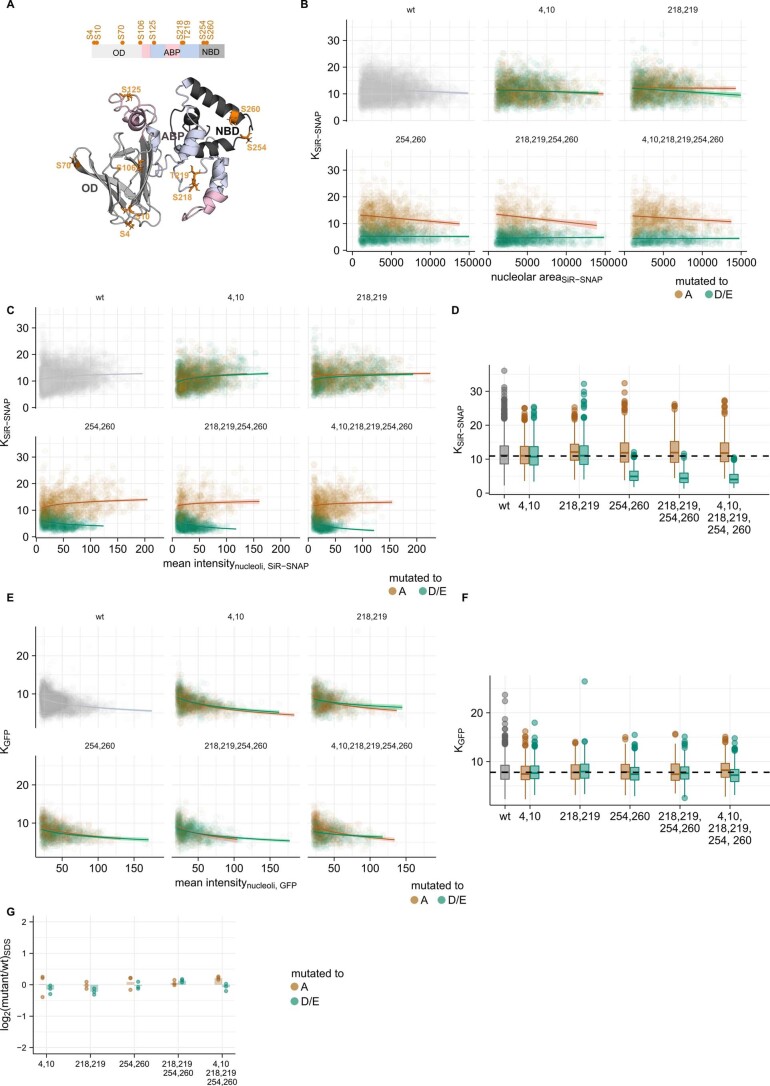
Extended Data Fig. 7. Localization of NPM1 and its phosphomutants.
(a) Model of NPM1 with the identified phosphosites highlighted in orange. Protein domains: OD- oligomerization domain, ABP- acidic basic patch and NBD- nucleic acid binding domain. (b) Scatter plot of calculated partition coefficient (K) from SiR-SNAP channel (y-axis) and size of individual (segmented-) nucleoli (x-axis) from at least three independent trials per construct. (c) Scatter plot of calculated partition coefficient from SiR-SNAP channel (KSiR-SNAP, y-axis) and mean intensity of SiR-SNAP in nucleoli (proxy for the expression level of SNAP-tagged protein, x-axis) for individual (segmented-) nucleoli from at least three independent trials per construct. (d) Box plot showing the distribution of KSiR-SNAP (partition coefficient calculated from SiR-SNAP channels for NPM1 wildtype (wt) and phosphomutants. The box plots display the median and IQR, with the upper whiskers extending to the largest value ≤1.5 × IQR from 75th percentile and the lower whiskers extending to smallest values ≤1.5 × IQR from 25th percentile. (e) Scatter plot of calculated partition coefficient from GFP channel (KGFP, y-axis) and mean intensity of GFP in nucleoli (proxy for the expression level of GFP-tagged wt-NPM1, x-axis) for individual (segmented-) nucleoli from at least three independent trials per construct. (f) Box plot showing the distribution of KGFP (partition coefficient calculated from GFP channels for NPM1 wildtype (wt) expressed as marker of nucleoli in all experiments. The box plots display the median and IQR, with the upper whiskers extending to the largest value ≤1.5 × IQR from 75th percentile and the lower whiskers extending to smallest values ≤1.5 × IQR from 25th percentile. (g) Barplot representing the relative protein abundance (in log2 scale, y-axis) of heterologously expressed SNAP-tagged phosphomutants (x-axis) of NPM1 compared to the wild type (wt) from three biological replicates.

