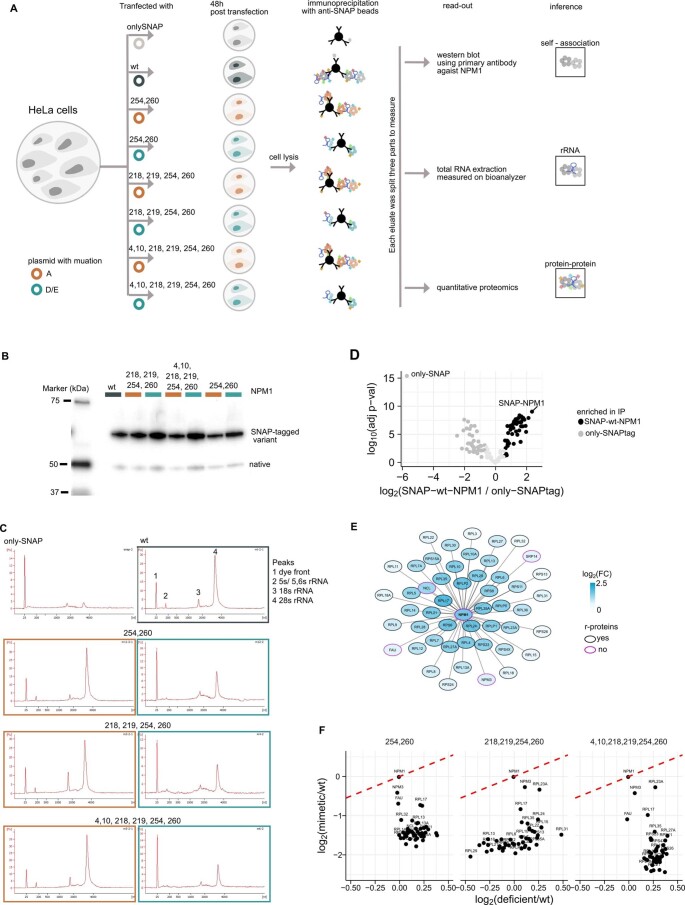
Extended Data Fig. 8. Phosphoregulation of NPM1 interactions.
(a) Schematic representation of the experimental set-up to capture the interaction of NPM1. (b) Western blot image of the eluate of the IP of different variants of NPM1 using primary antibody against NPM1. Two bands corresponding to heterologous expression (SNAP-tagged, high molecular weight) and native protein (low molecular weight) are observed. Higher amounts of SNAP-tagged phosphomimetic mutants are observed due to higher accessibility (due to higher solubility) to antibody based pull-down. (c) RNA elution profiles from Bioanalyzer showing the fluorescence intensity (in arbitrary units, y-axis) along the elution time (in seconds, x-axis) of NPM1 and its phosphomutants. (d) Differential analysis of proteins associated with SNAP-tagged wild type NPM1 compared to only-SNAP tag. Proteins represented in black (solid circle) are (at least 2-fold higher with an FDR < 0.1, limma analysis, p-value corrected with Benjamini-Hochberg procedure) defined as the specific protein-interactors of NPM1. (e) Protein-protein interactions of NPM1 represented in a network visualization. Each node represents ribosomal proteins (black outline) and non-ribosomal proteins (pink outline) specifically interacting with NPM1. (f) Scatter plot comparing the median fold changes (from n = 3 trials) of the amount of the specific protein interactors of NPM1 associated with phosphodeficient and mimetic versions of NPM1.

