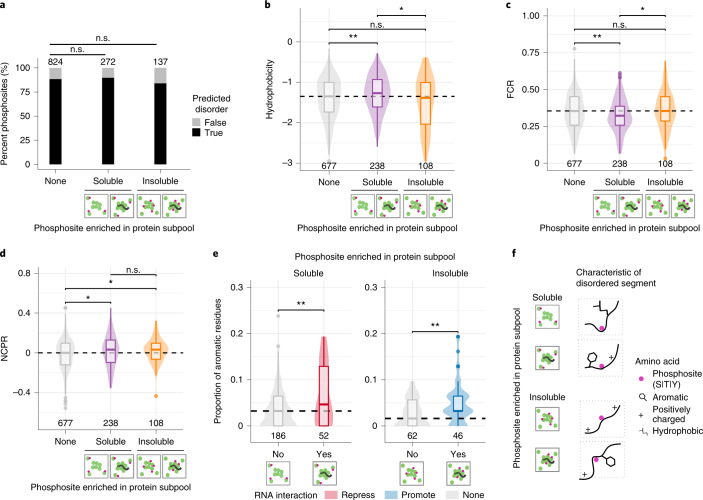
Fig. 3. Sequence properties of disordered segments surrounding solubility subpopulation-specific phosphosites are distinct.
a, Bar plot showing the proportion of phosphosites localized within the predicted disorder segments of proteins. Significance values were obtained using Fisher’s exact test; n.s., P > 0.05. b–d, Comparison of different sequence properties of 31-amino acid segment non-changing, soluble and insoluble subpool-enriched phosphosites (which were disordered based on Uversky classification). b, Hydrophobicity was calculated using the Kyte–Doolittle scale. c, The fraction of charged residues (FCR) was calculated as the sum of the fraction of positively charged (f+) and negatively charged (f−) residues. d, Net charge per residue (NCPR) was calculated as the difference between f+ and f−. The number of phosphosites in each category is indicated at the bottom of the representation. Significance was calculated using two-sided Wilcoxon signed-rank tests and is represented by *P < 0.05, **P < 0.01 and ***P < 0.001. The box plots display the median and the interquartile range (IQR), with the upper whiskers extending to the largest value ≤1.5 × IQR from the 75th percentile and the lower whiskers extending to the smallest values ≤1.5 × IQR from the 25th percentile. e, Comparison of the proportion of aromatic amino acids in the 31-amino acid segments of phosphosites, which are enriched in either the soluble (right) or insoluble (left) protein subpool and may or may not impact RNA interactions. Significance was calculated using a two-sided Wilcoxon signed-rank test and is represented by *P < 0.05, **P < 0.01 and ***P < 0.001. The box plots display the median and the IQR, with the upper whiskers extending to the largest value ≤1.5 × IQR from the 75th percentile and the lower whiskers extending to the smallest values ≤1.5 × IQR from the 25th percentile. The number of phosphosites in each category is indicated at the bottom of the representation. f, Schematic representation of key sequence properties observed in phosphosites that are enriched in soluble and insoluble subpools of proteins.

