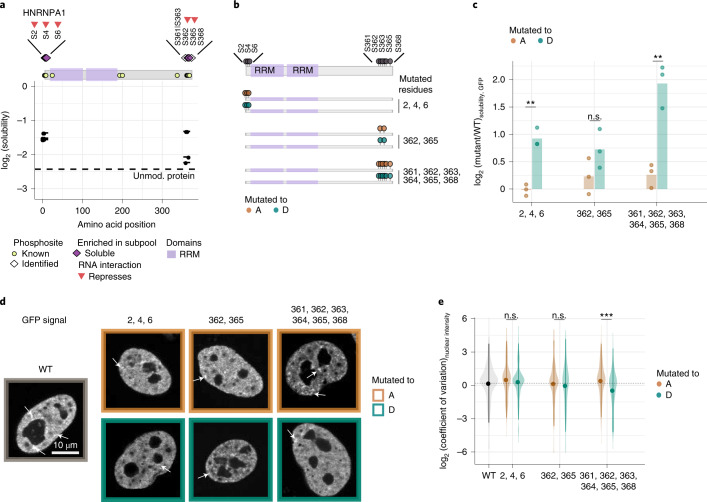
Fig. 4. Multisite phosphorylation of the HNRNPA1 C terminus impacts its solubility.
a, Visualization of the solubility profiles of identified phosphopeptides of HNRNPA1 and unmodified HNRNPA1 protein. Top, schematic representation of the protein with its domains and known phosphosites from UniProt is shown. Median solubility (of three independent measurements, y axis) of phosphopeptides (solid lines with points representing the sites) and unmodified protein (dashed line) in log2 scale is represented along the linear sequence of the protein (x axis). b, Schematic representation of different phosphodeficient (S to A) and phosphomimetic (S to D) mutants of HNRNPA1. These variants were expressed as GFP-tagged fusion proteins. RRM, RNA-recognition motif. c, Bar plot of the solubility (y axis) of GFP-tagged phosphodeficient and phosphomimetic mutants (sites are indicated on the x axis) of HNRNPA1 normalized to that of GFP-tagged WT protein is shown. Points represent the size effect calculated from three independent biological replicates. The variants of HNRNPA1 were expressed as GFP fusion proteins. Hence, the solubility of the tag (GFP) is used as the proxy to infer the solubility of HNRNPA1 variants. Mean from three independent trials are shown and the statistical significance was obtained by comparing the phosphodeficient and phosphomimetic mutant pairs using Student’s t-test (two sided) and is represented by *P < 0.05, **P < 0.01 and ***P < 0.001. d, Representative examples of a HeLa cell line transiently expressing the GFP-tagged HNRNPA1 mutant proteins depicted in b. GFP signal of WT in gray (left), phosphodeficient mutant proteins in brown (top) and phosphomimetic mutant proteins in green (bottom). Single z slices are shown. Scale bar, 10 µm. Examples of nuclear clusters are indicated with arrows. e, Coefficient of variation (s.d. ÷ mean intensity) of the nuclear signal of GFP-tagged WT and variants of HNRNPA1. Violin plot displays the underlying distribution of the coefficient of variation calculated from at least 120 nuclei from two independent experiments. The mean and s.d. are represented as a point and solid lines. Statistical significance was obtained using Student’s t-test (two sided) and is represented by *P < 0.05, **P < 0.01 and ***P < 0.001.

