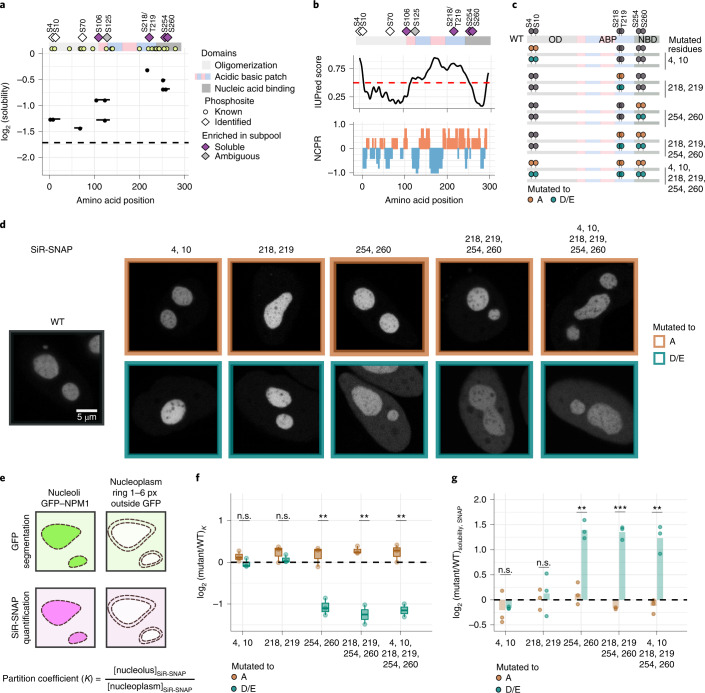
Fig. 5. Phosphorylation of S254 and S260 are crucial for NPM1 localization.
a, Visualization of the solubility profiles of identified phosphopeptides of NPM1 (solid lines, phosphosites as points) and unmodified NPM1 protein (dashed line). Top, schematic representation of the different protein domains and previously known phosphosites are shown. b, IUPred, prediction of intrinsic disorder (top) and net charge per residue (calculated over a five-amino acid window, bottom) along the linear sequence of NPM1. c, Schematic representation of different phosphodeficient (S|T to A) and phoshomimetic (S to D|T to E) mutants of NPM1. ABP, acidic basic patch; NBP, nucleic acid binding; OD, oligomerization domain. d, Representative examples of a HeLa cell line overexpressing WT GFP-tagged NPM1 from a bacterial artificial chromosome (BAC) and transiently expressing the SNAP-tagged NPM1 mutant proteins depicted in c. SiR-SNAP signal of WT is in dark gray (left), phosphodeficient mutants are in brown (top), and phosphomimetic mutants are in green (bottom). Single z slices are shown. Scale bar, 5 µm. e, Schematic of nucleolus and nucleoplasmic segmentation. WT GFP–NPM1 was used for nucleolus segmentation, and a rim surrounding each nucleolus was used for the nucleoplasmic segmentation. SiR-SNAP signals were quantified. The partition coefficient (K) is the proportion of nucleolar intensity to nucleoplasmic intensity. px, pixels. f, Box plot of relative K values (y axis) of SNAP-tagged NPM1 mutants (x axis) with respect to SNAP-tagged NPM1 WT from at least three independent trials is shown in log2 scale. Dashed lines represent the effect size of SNAP-tagged NPM1 WT (n ≥ 3). Statistical significance was obtained by comparing the phosphodeficient and phosphomimetic mutant pairs using Student’s t-test (two-sided) and is represented by *P < 0.05, **P < 0.01 and ***P < 0.001. The box plots display the median and the IQR, with the upper whiskers extending to the largest value ≤1.5 × IQR from the 75th percentile and the lower whiskers extending to the smallest values ≤1.5 × IQR from the 25th percentile. g, Bar plot of mean protein solubility (y axis, from three independent trials) of SNAP-tagged NPM1 mutants (x axis) with respect to SNAP-tagged NPM1 WT measured using the proteomic assay. Points represent the solubility measured from n = 3 experiments. Statistical significance was obtained by comparing the phosphodeficient and phosphomimetic mutant pairs using Student’s t-test (two-sided) and is represented by *P < 0.05, **P < 0.01 and ***P < 0.001.

