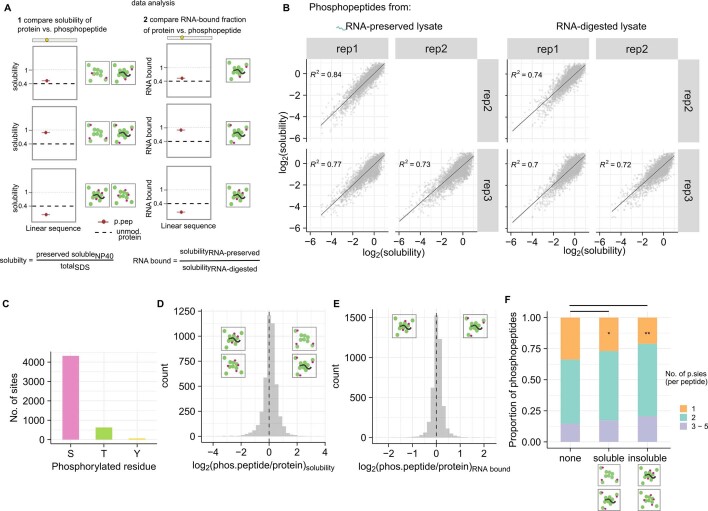
Extended Data Fig. 3. Differentially soluble phosphopeptides.
(a) Schematic representation of data analysis and interpretation strategies of combining phosphoproteomics with solubility proteome profiling. (b) Scatter plot comparing the reproducibility of phosphopeptides solubility measurements (in log2 scale) from three independent replicates from RNA-preserved and RNA-digested lysate. (c) Bar plot representation of number of phosphorylated serine (S), threonine (T) and tyrosine (Y) residues identified in this dataset. (d) Histogram showing the difference in solubility of phosphopeptides and their corresponding unmodified proteins (x-axis in log2 scale) in RNA-preserved lysate. (e) Histogram showing the difference in RNA-bound fraction of phosphopeptides and their corresponding unmodified proteins (x-axis in log2 scale). (f) Barplot representing the proportion of single, double and multiple phosphorylation sites containing peptides among differenentially soluble phosphopeptides. Fisher’s exact test was utilized to ascertain the significance. ** p-value < 0.01, * p-value < 0.05.

