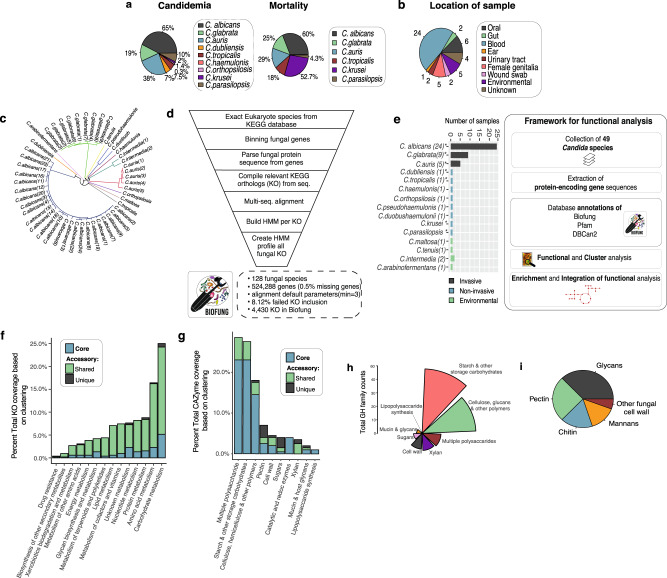
Fig. 1. Exploration of Candida species with BioFung database.
a Contribution of individual Candida species to candidemia and mortality. The impact of each species in AGAu species’ grouping is attributed in this study (literature-based)16–18,20,152. b Candida strain characterisation. Coverage of Candida sample population per species available with the categorisation of species profiled. Numbers around the pie chart signify the number of strain representation in each location. (Supplementary Data 3 for more information about strains and Supplementary Figure 1a for the global representation of Candida strains). c Genome-based phylogenetic tree. The phylogenetic tree was constructed based on average nucleotide identity (ANI) between all strains revealing evolutionary differences across strains (colour coordinated) and indicating distinct metabolic capabilities. See Supplementary Fig. 1b for quality of sequences. d BioFung database creation workflow. Eukaryote annotation from KEGG database parsed to extract all fungal species. They were genes parsed, sequences extracted and reassembled to KO. The multi-sequence alignment was performed on each KO with all corresponding sequence available. HMM, profile built based on each KO and assembled to provide a more accurate annotation of fungal species for KO. e Distribution of Candida species based on sample collection and the framework of protein-encoded genes analysis of Candida strains. Strains isolated from the various location providing relevant clinical association to host mycobiome and environmental species. *indicates clinical strains used for metabolomics. Functional analysis performed on 49 Candida species collected from public repositories. Protein sequences were annotated with Pfam, dbCAN2 and BioFung database for biological information. f Core and accessory overview of the metabolic pathway across Candida strains. Shared genome feature refers to 6–48 species sharing the function and unique genome features is exhibited by less than 5 Candida species denoting accessory functions. g Clustering of carbohydrate-active enzyme profile (CAZyme). Core, shared genome (6–48 strains), and unique genome (<5 strains) illustrates distribution analysis of functions across all Candida species. h Breakdown of GH family substrate-converter activity. Analysis of enzyme function of glycoside hydrolase family across all Candida strains. i Breakdown of cell wall composition of core Candida strains with identification of 49 CAZymes.

