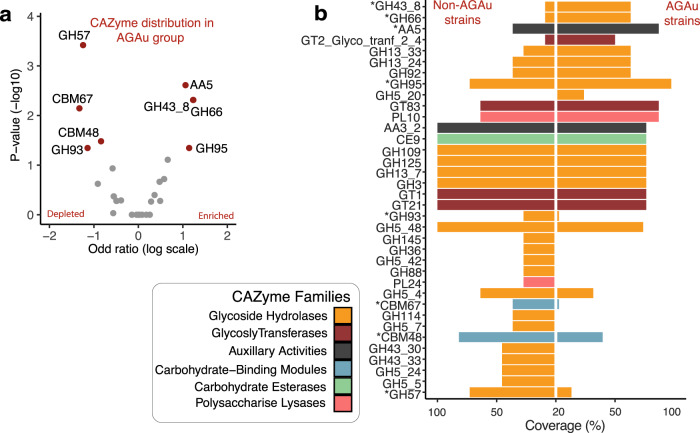
Fig. 2. CAZyme profile in AGAu Candida strains.
a CAZyme analysis across AGAu and non- AGAu groups. (*Asterisk connotes statistically significant CAZyme, Chi-square tests, p values < 0.05). b CAZyme enrichment and depletion in AGAu strains. Volcano plot showing statistically significant evidence of a relationship between AGAu strains (Chi-square tests, p values < 0.05 and odds ratio on enriched and depleted in AGAu strains, in red).

