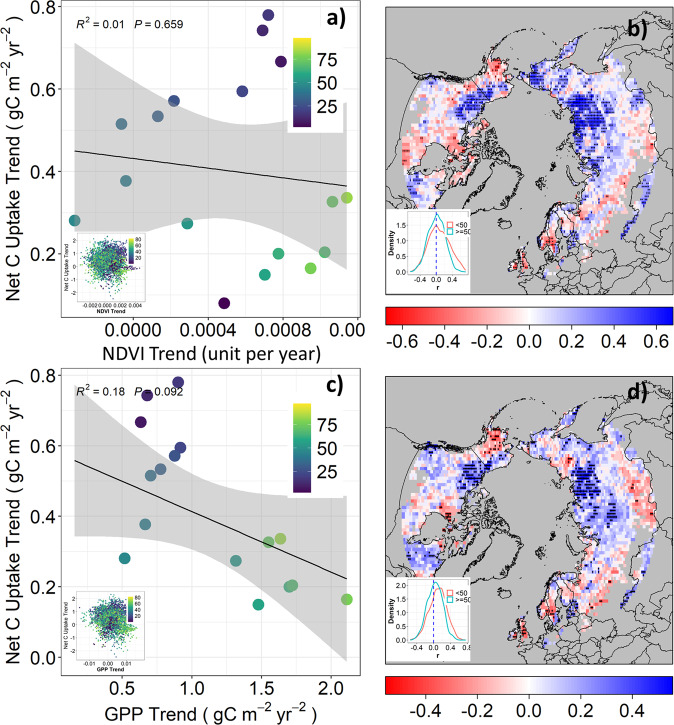
Fig. 2. Weak negative correlations between trends of productivity and net CO2 uptake suggesting productivity alone cannot explain the different trends of net CO2 uptake along the tree cover gradient.
a, c show correlation between trends of GIMMS NDVI or LUE GPP and net CO2 uptake trends along the 5% tree cover interval gradient (blue to green), respectively. Insets show the correlation at pixel level. b and d are spatial patterns of correlation (r) between GIMMS NDVI or LUE GPP and net CO2 uptake, respectively. Points indicate trends are significant at 0.05 level. Insets show the distribution of r between regions with TC > = 50% and TC < 50%.

