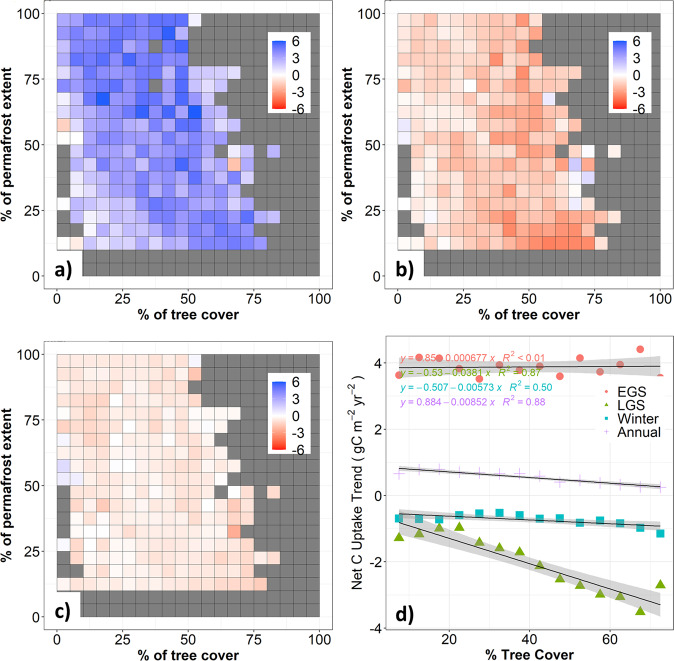
Fig. 3. Seasonal compensation explains the different trends of net CO2 uptake along tree cover and permafrost gradients in the NHL.
a–c show increasing net CO2 uptake in the early-growing season (a; EGS: May-Aug) and increasing net CO2 release in the late-growing season (b; LGS: Sep-Oct) and winter (c; Win: Nov-Apr). d shows the variation in net CO2 uptake seasonal trends along the 5% tree cover interval gradient in the NHL. Pixels with grey color represent environmental conditions that do not exist.

